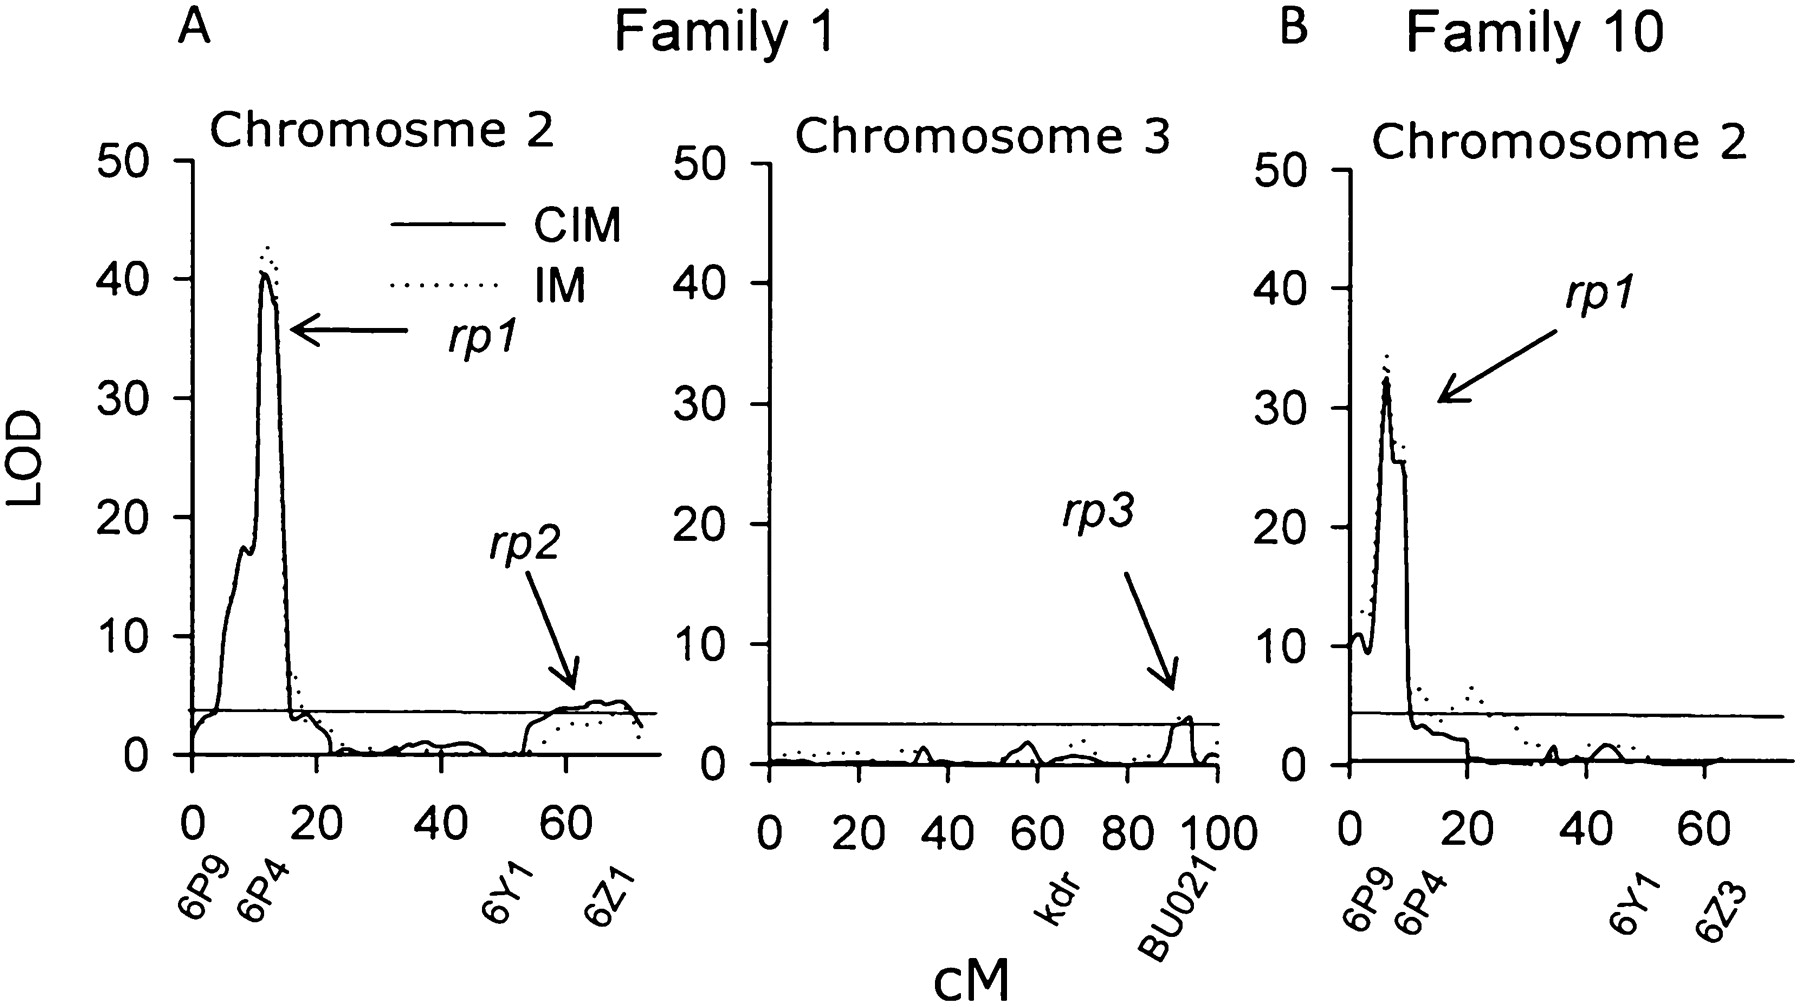
Figure 1.
Plot of LOD scores associated with pyrethroid resistance in Family 1 (A) and in Family 10 (B) using F6 progeny. The y-axis indicates LOD ratio scores, and the x-axis indicates chromosome positions. (Solid lines) LOD estimated by composite interval mapping, (dashed lines) LOD estimated by interval mapping. The straight line along the top of each graph represents the threshold value for LOD as determined by permutations. Names of markers are listed around QTL locations.