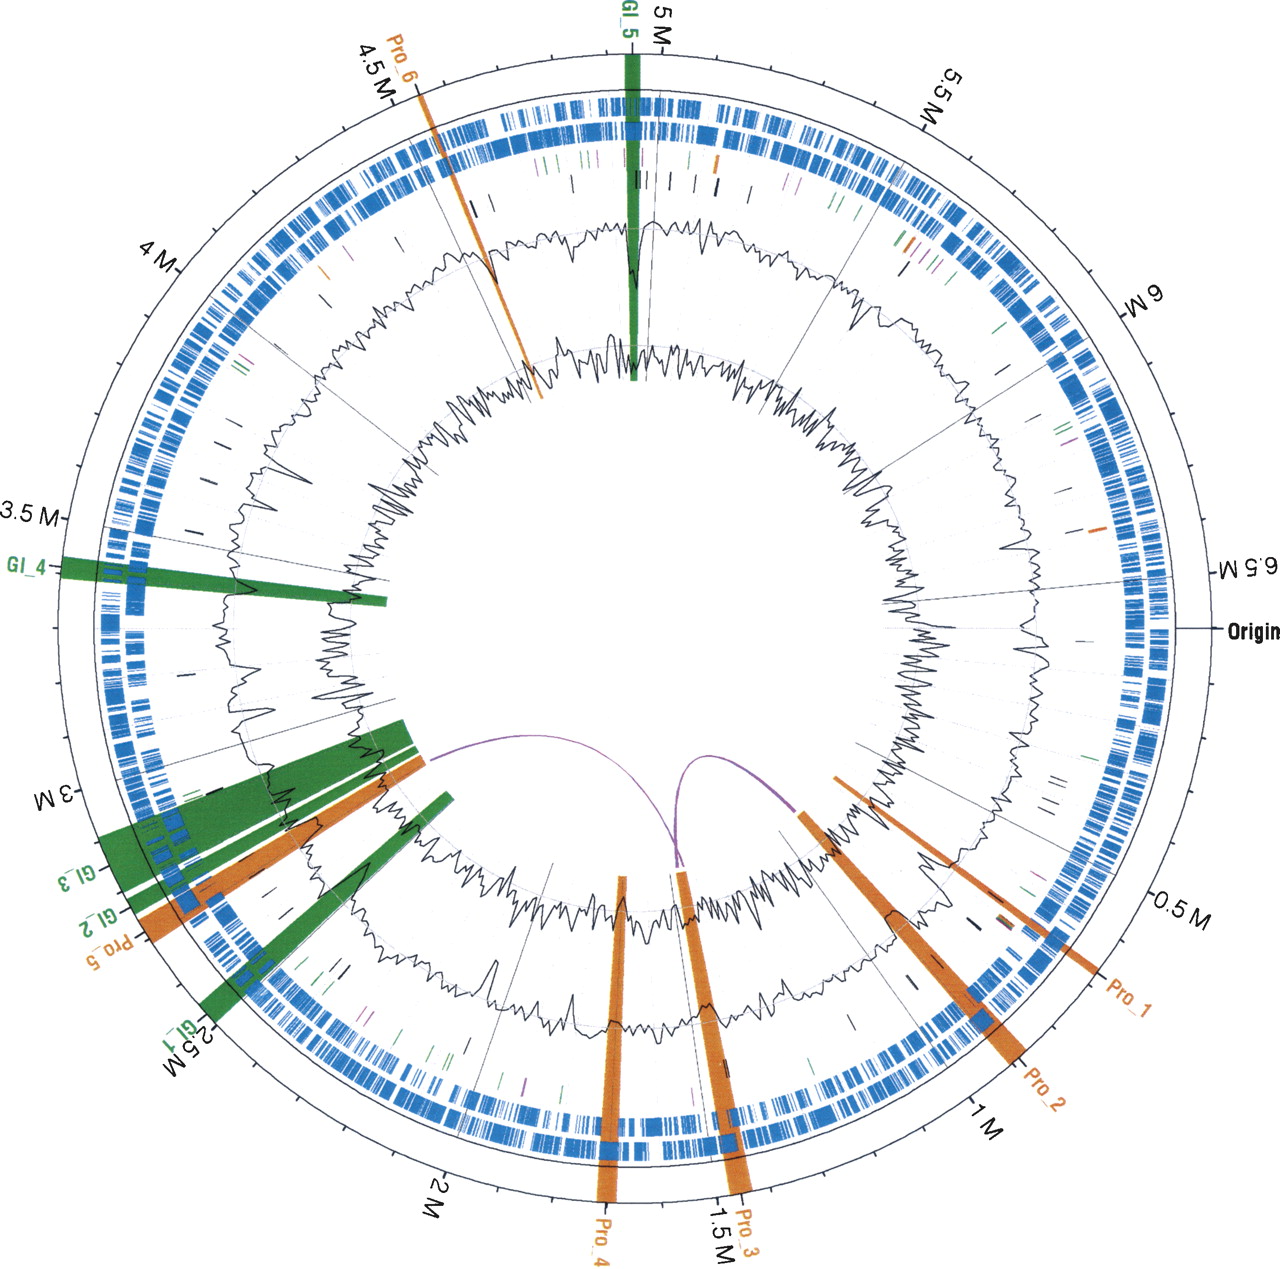
Circular map of the P. aeruginosa LES genome. Starting from outermost circle going inwards: major (500 kb) and minor tick (100 kb) measurements of the genome with estimated location of the origin; prophage (orange) and genomic islands (green) are highlighted across all tracks; protein coding genes (blue) on plus (outer) and minus strand (inner); tRNAs (green), rRNAs (orange), and all other noncoding RNA genes (purple); signature tagged mutants (black); GC content (outer black line plot) with GC content average (gray line); and GC skew (inner black line plot) were calculated using a 10-kb non-overlapping window. Note that one region of low GC, upstream of the first noted prophage, plus additional smaller regions of low GC, contain ribosomal genes that are commonly known to have a lower GC in genomes. The location of two highly similar genomic regions of length 7.5 kb and 13.5 kb within the prophages are marked with looping purple lines, between their locations on the innermost circle. The identified prophage and GIs are distributed around the genome, but there is one notable cluster of LESGI-1, LESGI-2, and LESGI-3, reflecting the nonrandom nature of GI insertion in P. aeruginosa (Wiehlmann et al. 2007). Significant sequence composition bias in seven of the nine regions was computationally identified (Table 2), while GC content deviating from the average can be observed for these regions in the figure.