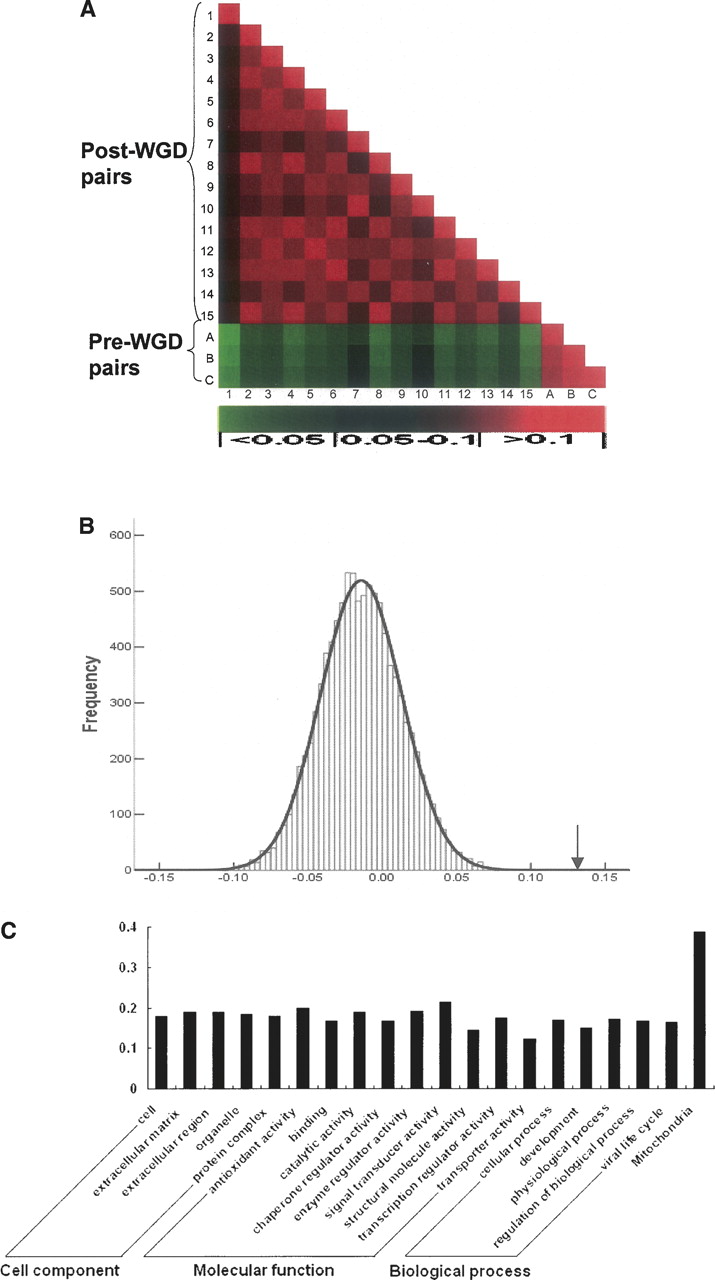
Mitochondrial genes evolve faster in post-WGD yeast species. (A) Pairwise comparison of the normalized dN values for mitochondrial genes. Numbers and letters to the left and at the bottom of the figure indicate species pairs. (1–15, post-WGD species pairs; A–C, pre-WGD species pairs. 1, Sces-Spar; 2, Sces-Smik; 3, Sces-Sbay; 4, Sces-Scas; 5, Sces-Kpol; 6, Spar-Smik; 7, Spar-Sbay; 8, Spar-Scas; 9, Spar-Kpol; 10, Smik-Sbay; 11, Smik-Scas; 12, Smik-Kpol; 13, Sbay-Scas; 14, Sbay-Kpol; 15, Scas-Kpol; A, Kwal-Sklu; B, Kwal-Klac; C, Sklu-Klac [see Methods “Sequence Data” section for abbreviation descriptions]). The color in each intersecting cell represents the P-value of the comparison between mitochondrial gene dN values for the two species pairs in that row and column, respectively. The scale of P-values is shown at the bottom of the figure. (B) Distribution of the evolutionary rate increase in the post-WGD species. The distribution was obtained by randomly sampling 296 genes, calculating their evolution rate increase in the post-WGD species, and iterating the process for 10,000 times. The X-axis is the average evolutionary rate increase in the post-WGD species. The curve represents the normal distribution estimated from the simulated data, and the arrow indicates the observed evolutionary rate increase for the mitochondrial genes (P < 1.0 × 10⁻⁴). (C) Proportions of genes that have increased evolutionary rates in the post-WGD species. Non-mitochondrial genes were grouped into 19 different categories based on their Gene Ontology (GO) annotations. The Y-axis indicates the percentage of genes with increased rates of evolution in the post-WGD species. The similar results were obtained using a nonredundant set of more specific GO categories for biological function (Myers et al. 2006) or subcellular location data (Supplemental Fig. 2A,B).