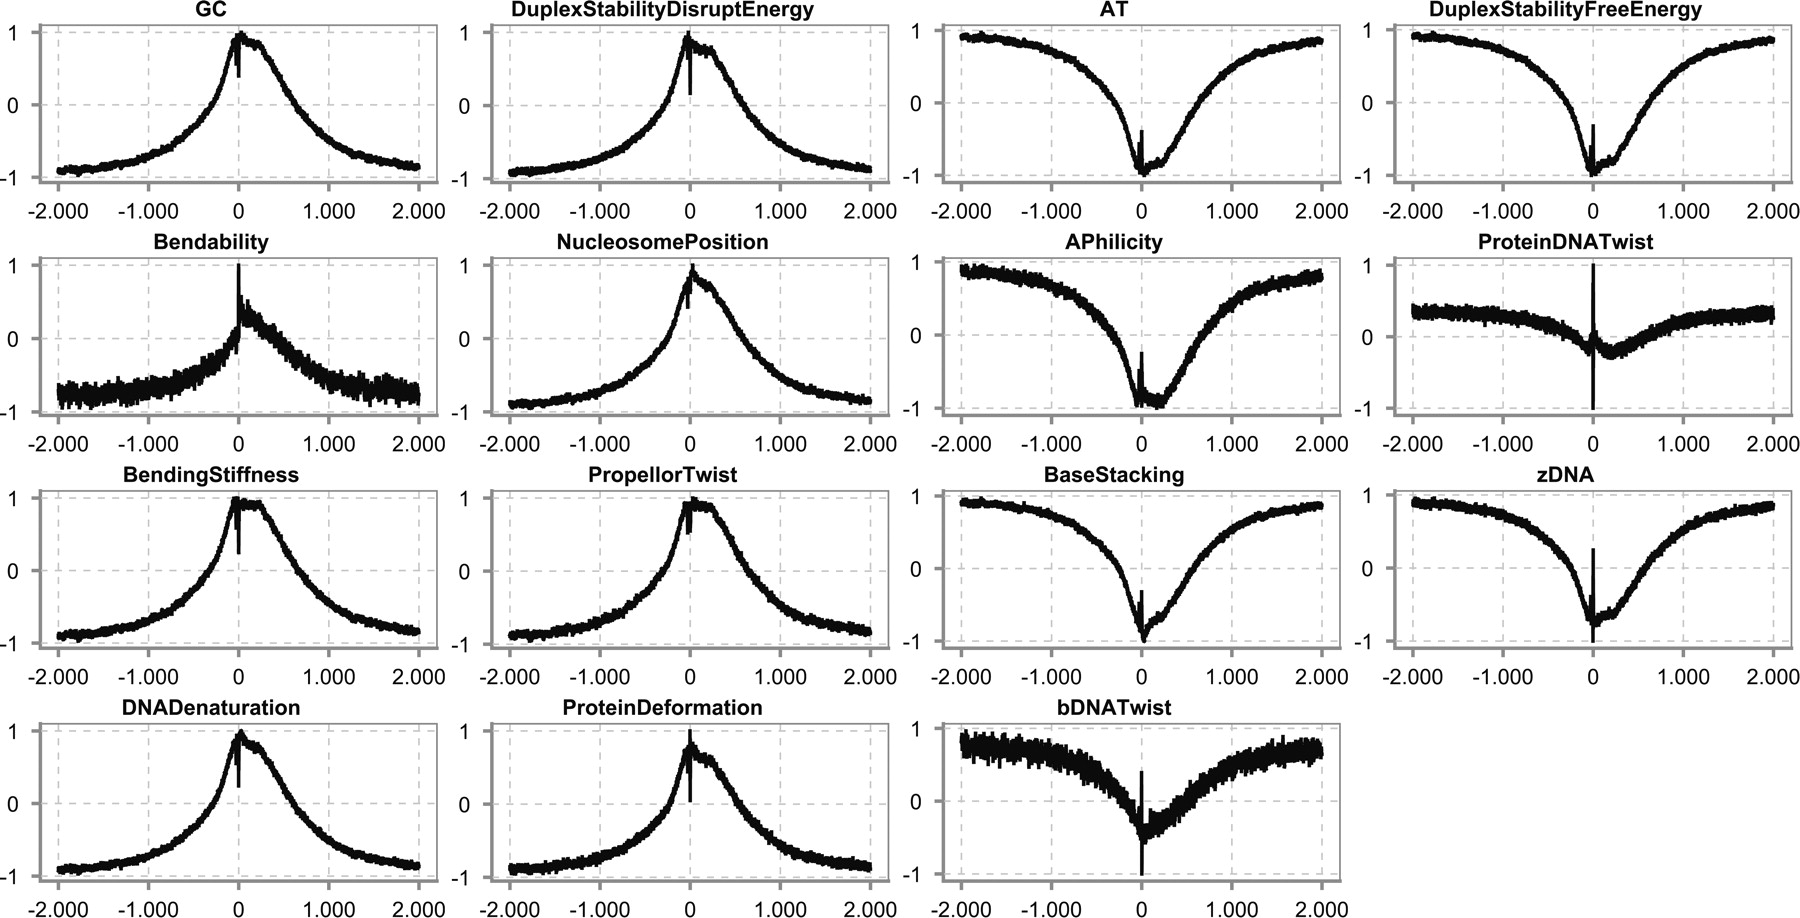
Examples of numerical profiles representing structural properties of the DNA in human over long-range distances around the transcription start site (TSS) (2000 bp upstream and 2000 bp downstream). The numeric profiles contain the actual average values on each position and are not smoothed using a window. Structural properties can be divided into two broad categories: those for which the numerical profile shows a peak around the TSS (e.g., GC content, bendability, and DNA denaturation), and those for which the profile shows a cleft around the TSS (e.g., AT content, bDNA twist, and Duplex Stability-Free Energy). (X-axis) Position relative to the TSS; (Y-axis) normalized value for each of the different properties. The profiles are based on the properties listed in the first column of Table 2. The coordinates for the TSS were retrieved from Ensembl, and the sequences were extracted around this TSS.