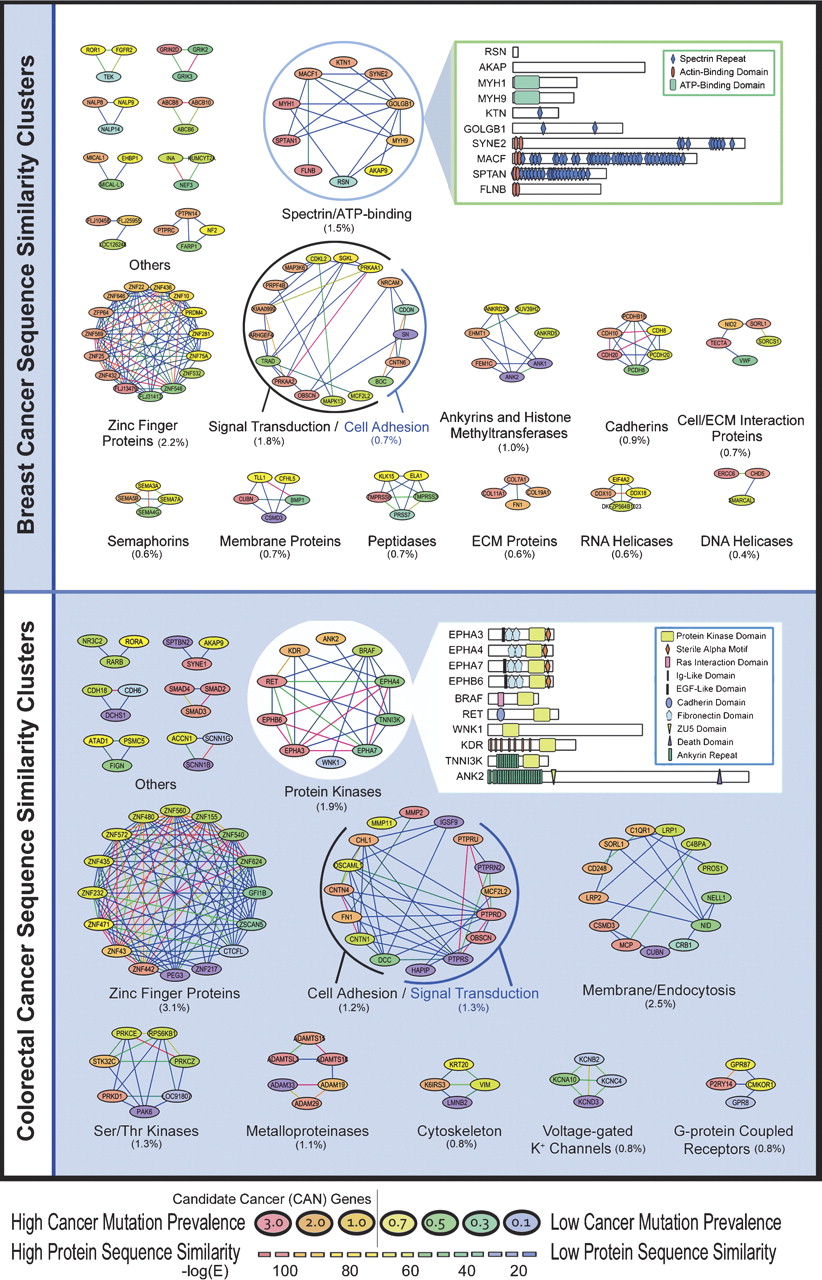
Sequence similarity among mutated genes in breast and colorectal cancers. Each cluster represents genes that are mutated in breast (top) or colorectal cancers (bottom). Each node represents a gene that is colored according to the Cancer Mutation Prevalence Score (CaMP score), and each line represents a sequence-similarity relationship that is colored according to degree of sequence similarity. CAN-genes identified by Sjöblom et al. (2006) have a CaMP score >1 and are colored in orange and red. Clusters are named according to the predominant genes contained within each cluster, and those containing only two genes are not shown. The percentage of the total mutated genes contained within each cluster is showed in parentheses. The inset highlights local similarity within protein domains of genes in a specific cluster.