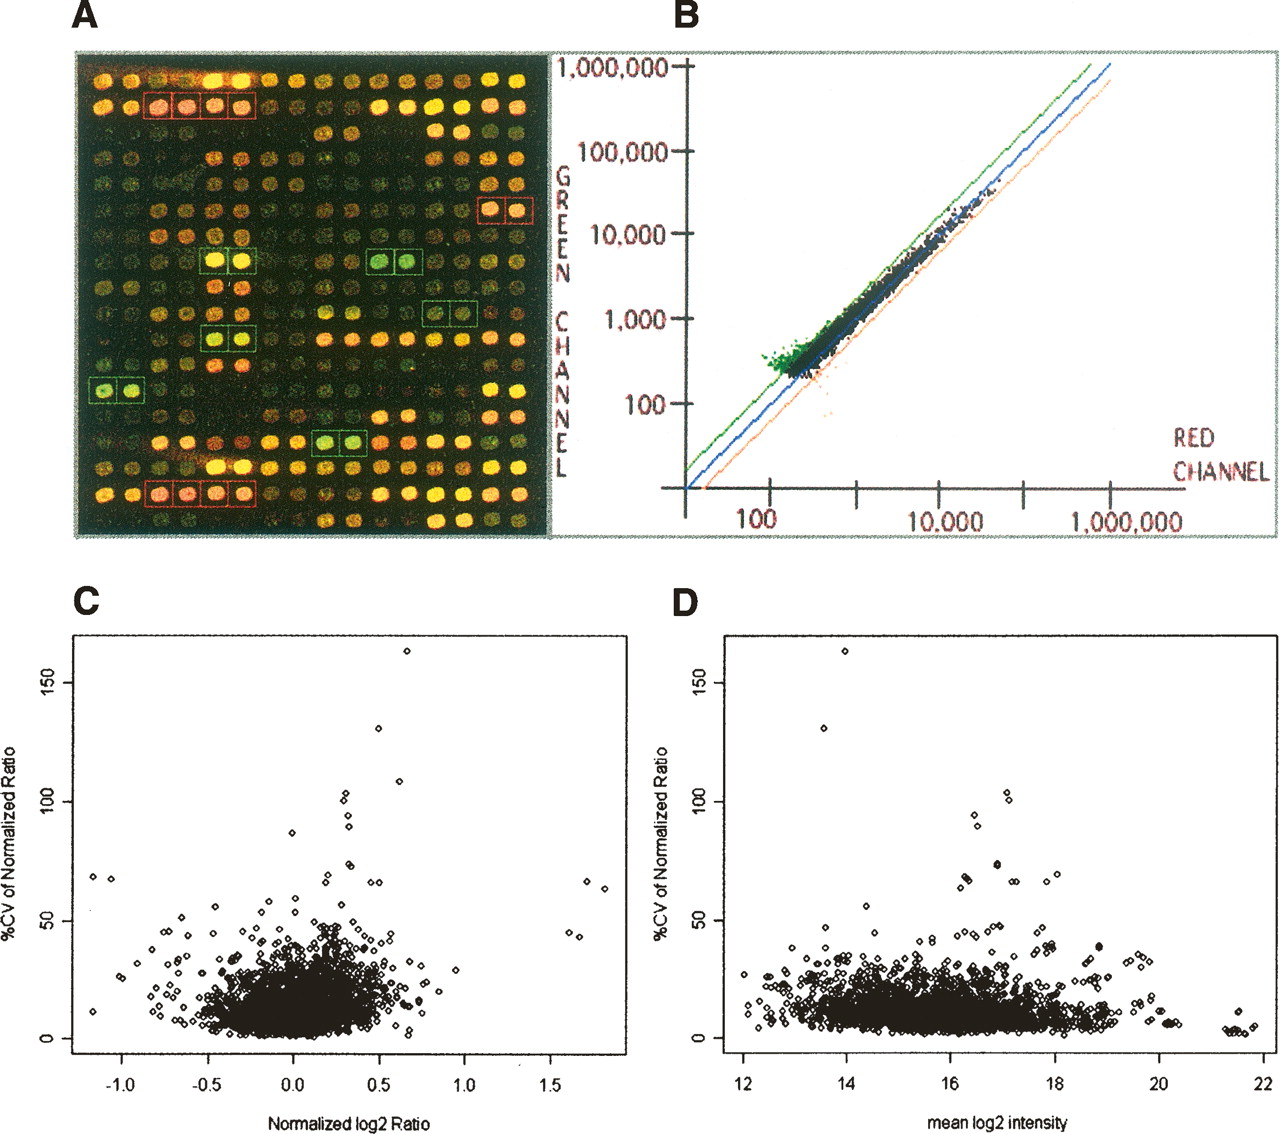
Figure 1.
A custom-built human X chromosome cDNA microarray (XCA). (A,B) A scanned microarray image and an example scatter-gram of data from the XCA, respectively. (C,D) The coefficients of variation (CV) of the normalized ratios across the microarray replicates of six normal controls (C) The percent CVs of normalized ratios plotted against the inter-microarray means of the base 2 logarithms of the normalized ratios across the biological replicates. (D) The percent CVs of normalized ratios plotted against the inter-microarray means of the log intensity on base 2 averages between the two channels of the normal and reference samples.