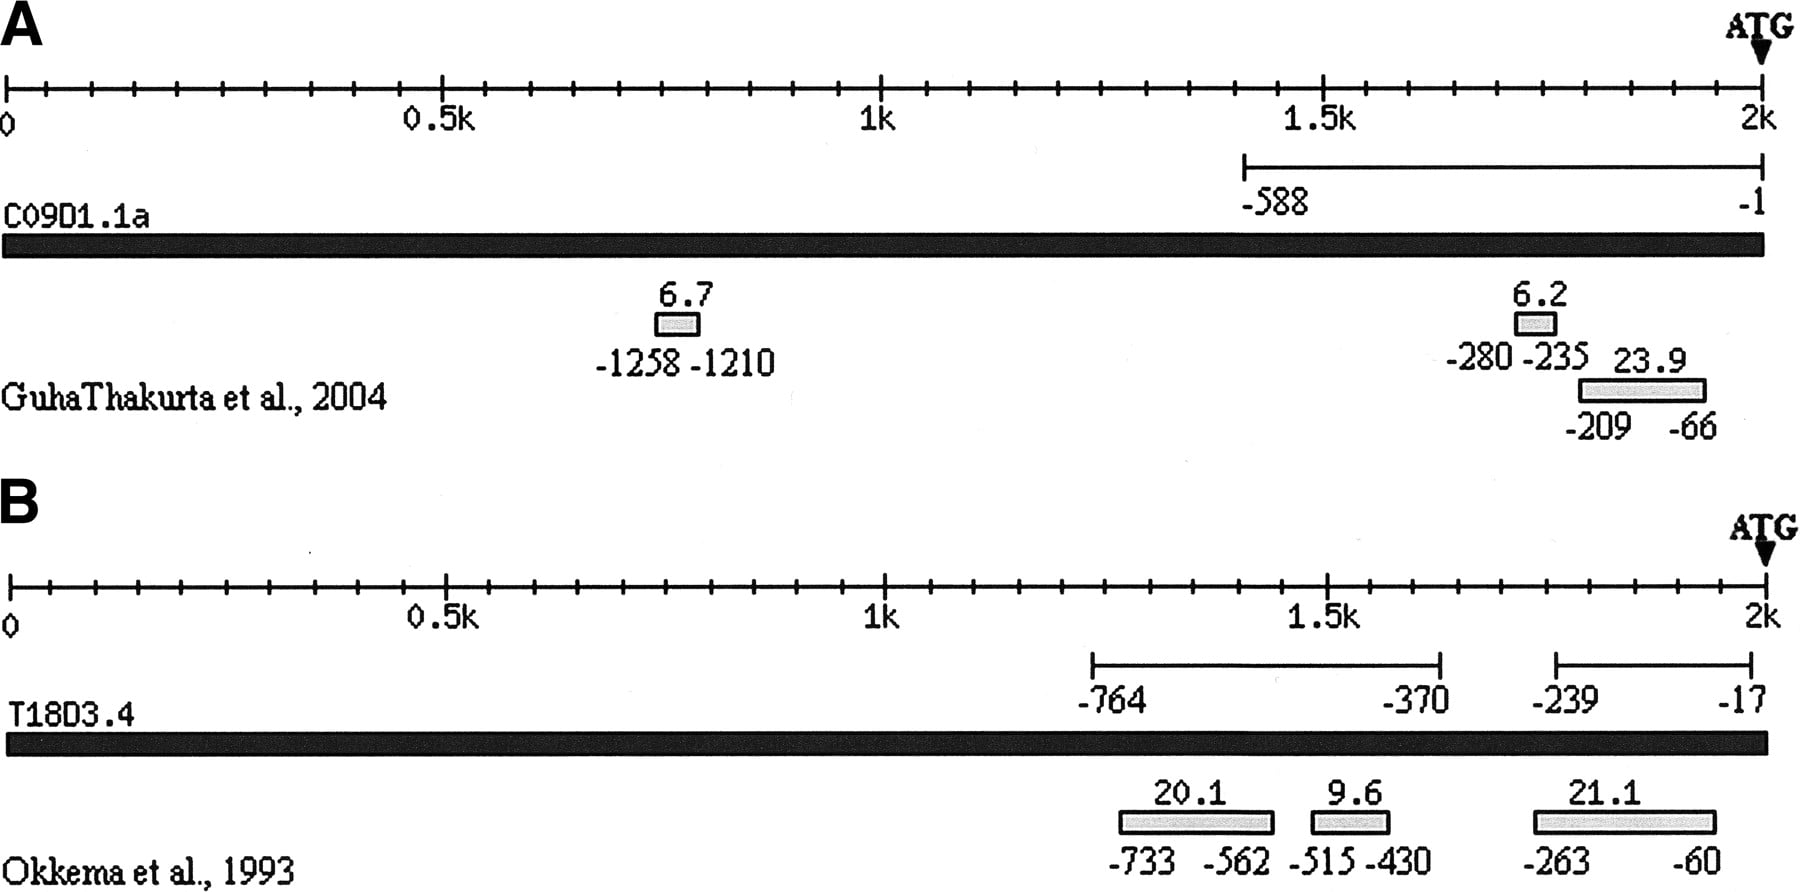
Two examples of comparison between predicted modules and experimentally defined modules. The lines below the scale represent the experimentally defined modules with start and end positions labeled. The black filled box represents the DNA sequence of corresponding gene. The end at the right side is −1 position of the gene. The small filled boxes below represent predicted modules with start and end positions labeled below. Black filled triangles indicate translational start sites. (A) For C09D1.1a, −1 to −588 bp upstream of ATG is an experimentally defined module. Our method predicted three modules and two are located within the first 588 bp (−66 to −209, −235 to −280). (B) T18D3.4 has two experimentally defined modules, −17 to −239 and −370 to −764. We predicted three modules, and all three are located within experimentally defined regions.