Skip to main content
Figure 1.
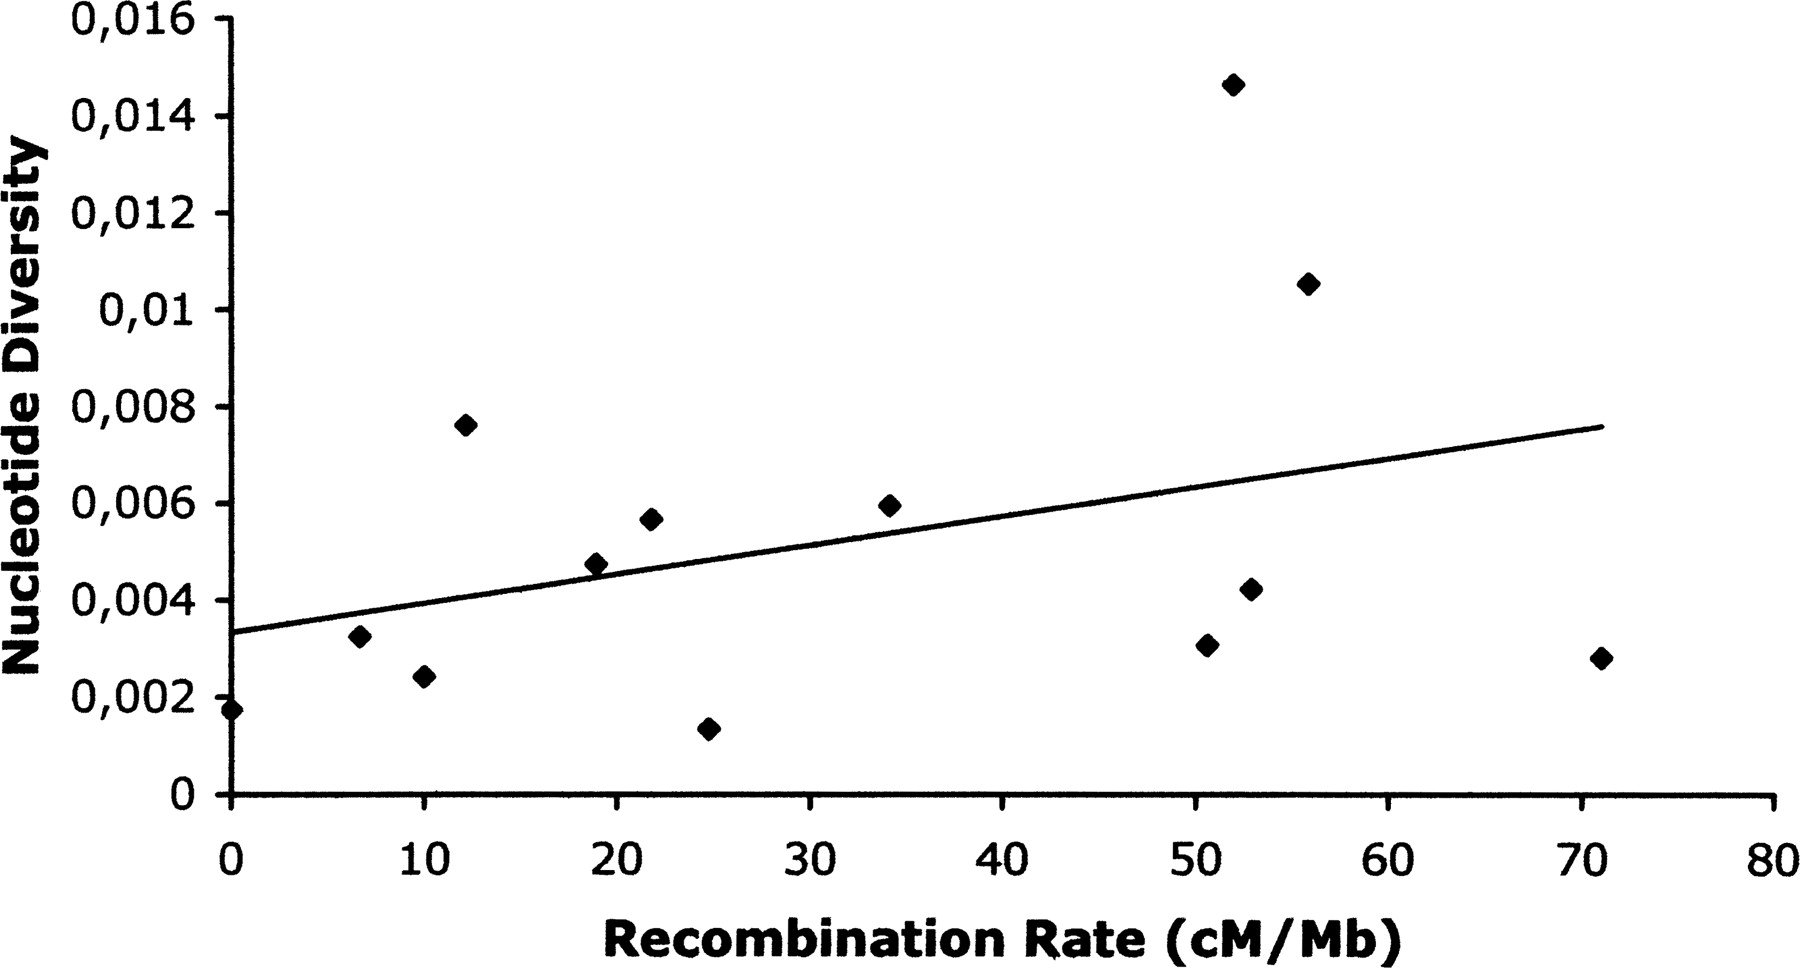
Scatter plot of nucleotide diversity, θ, vs. recombination rate (Spearman's ρ = 0.324;
P
= 0.28).