Figure 1.
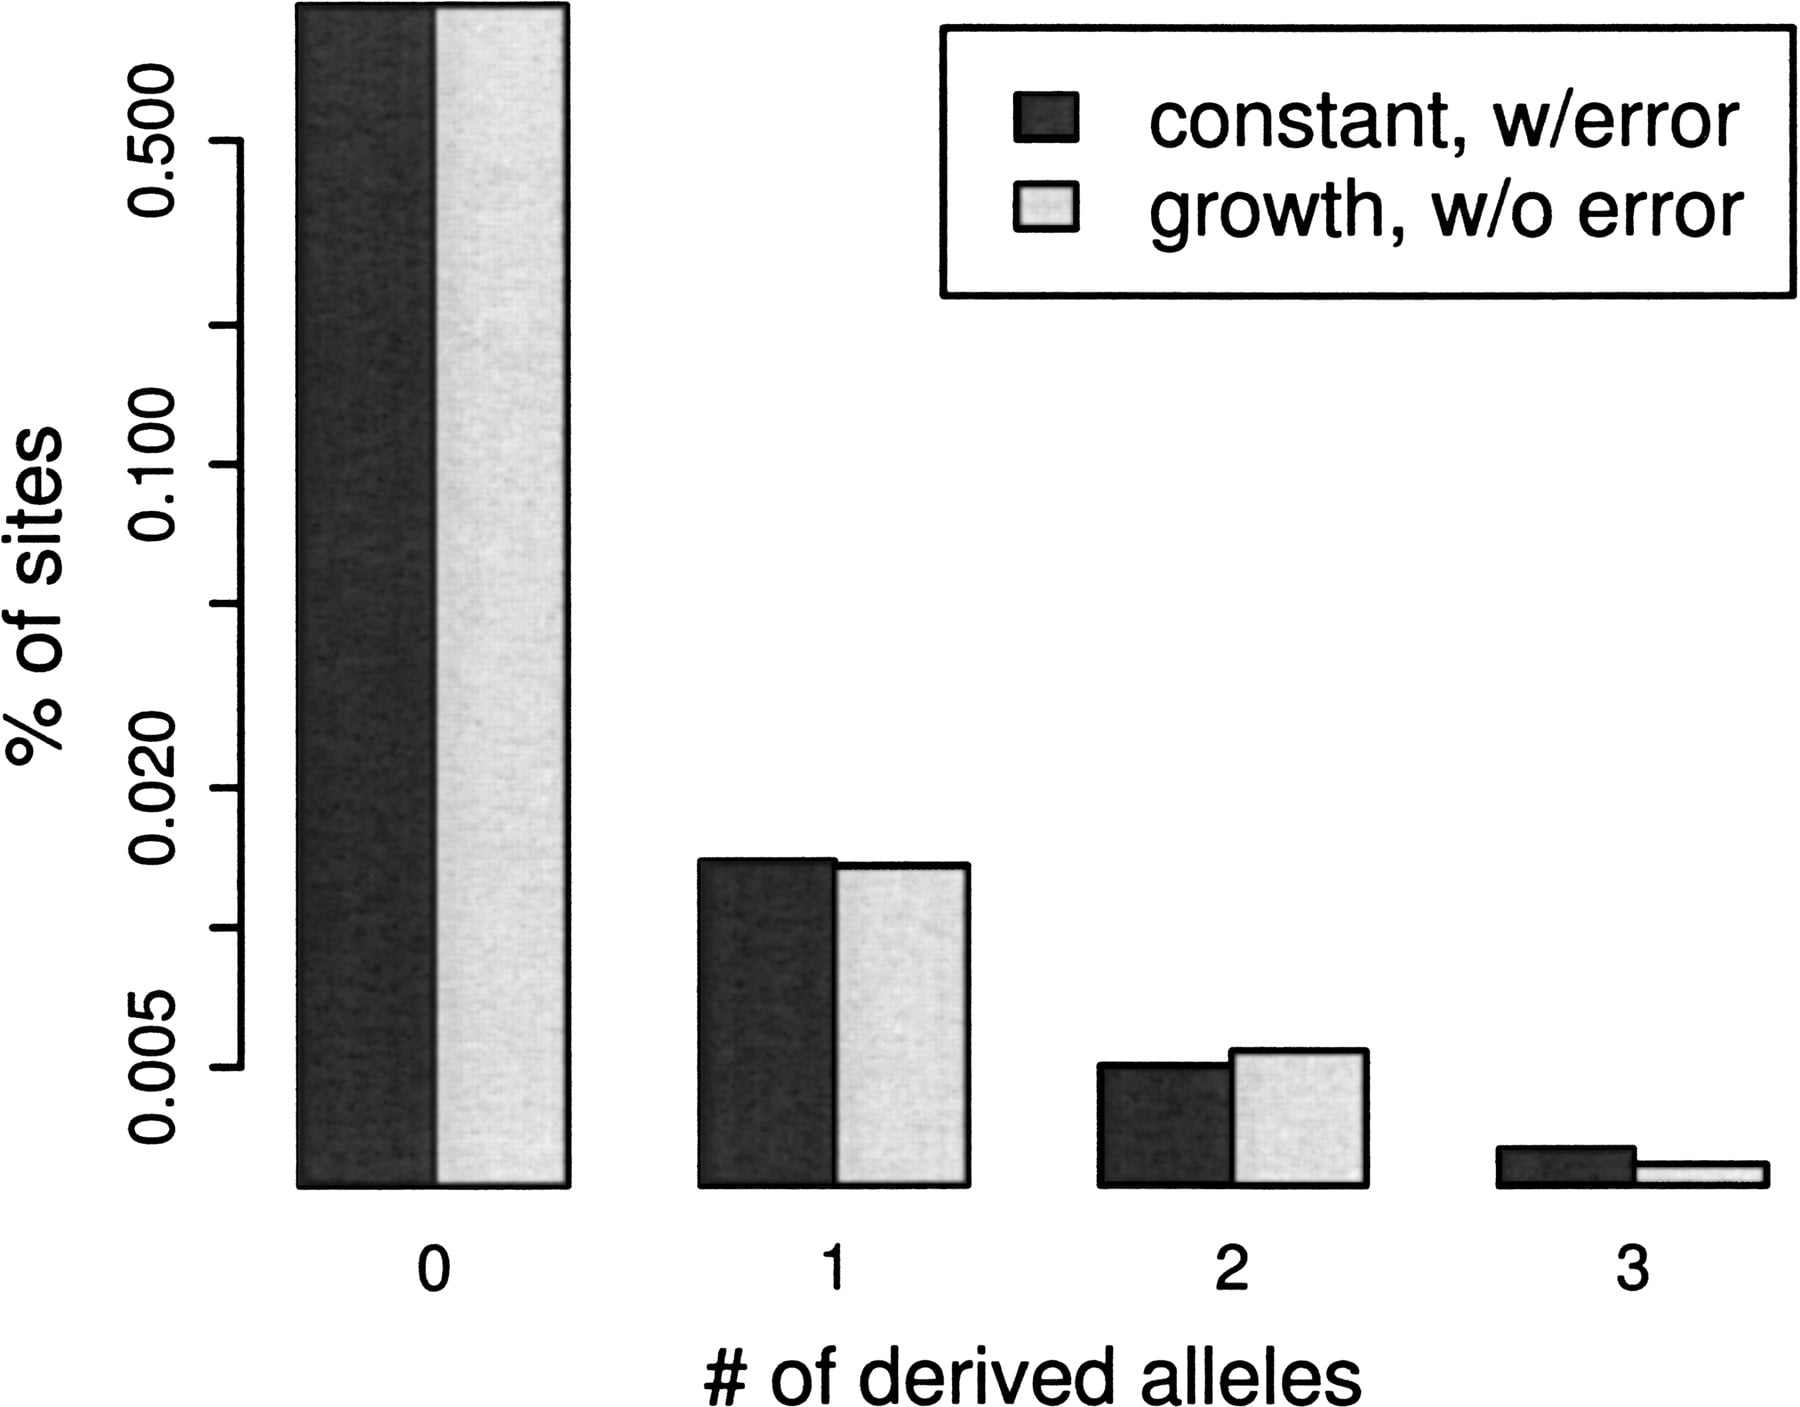
Similarity of sequencing error in constant size population (dark bars: θ =0.01, R= 0, q = 0.001) to population growth (light bars: θ = 0.02, 1, q = 0) with low-read depth (n = 4).
Similarity of sequencing error in constant size population (dark bars: θ =0.01, R= 0, q = 0.001) to population growth (light bars: θ = 0.02, 1, q = 0) with low-read depth (n = 4).