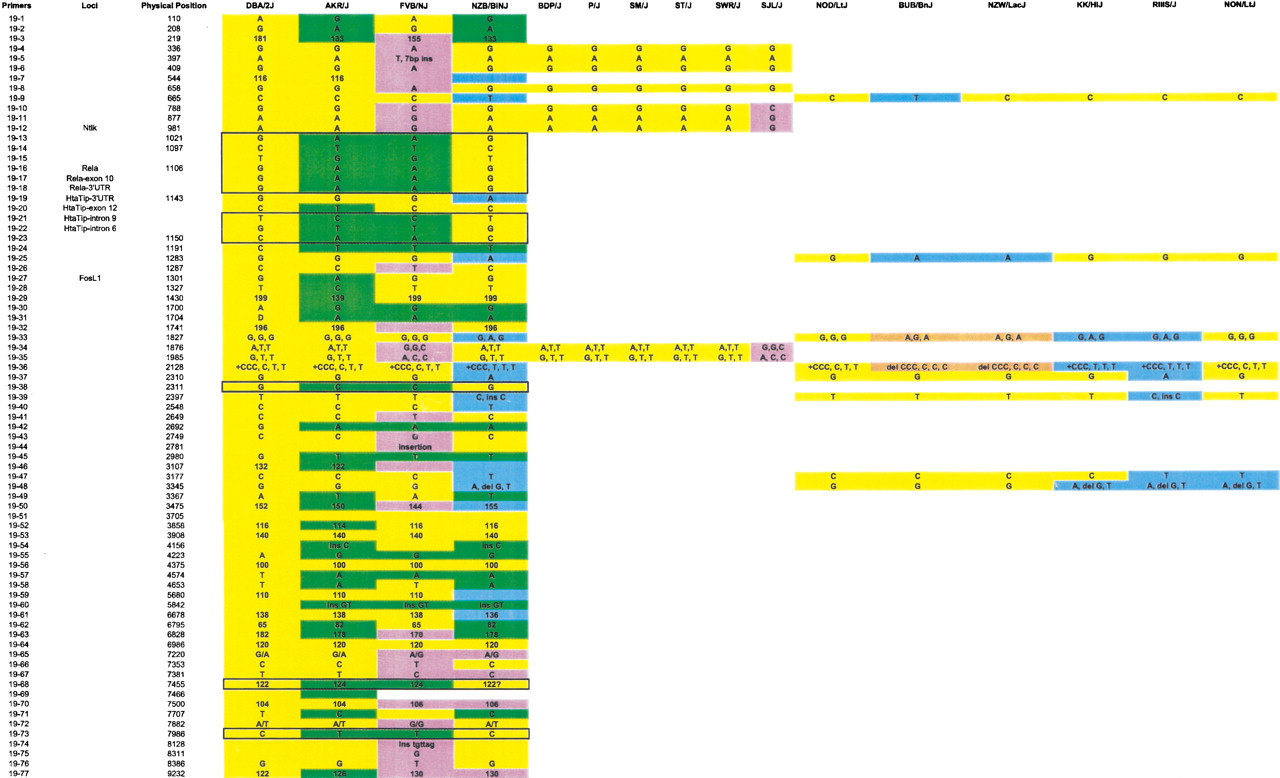
Haplotype map of proximal Chromosome 19. The mouse strains screened are indicated across the top of the figure. Primer pairs are listed in the left-hand column. Haplotypes are indicated by colors. The polymorphisms present in DBA/2J (yellow), AKR/J (green), FVB/NJ (purple), NZB/B1NJ (light blue), BUB/BnJ and NZW/LacJ (pink) are indicated. The polymorphisms observed are shown in each cell. (Del) Deletion, (ins) insertion. When multiple polymorphisms were observed, commas separate the polymorphisms. Microsatellite-based polymorphisms are shown as PCR product size, in base pairs. For those microsatellites that were significantly different in size, as determined by agarose gel electrophoresis, the exact size was not determined, so no base pair size was included in the figure. The physical position column indicates the distance, in kilobases, from the centromere according to the Celera database. The haplotype blocks that segregate appropriately according to the coinheritance hypothesis are boxed.