Figure 1.
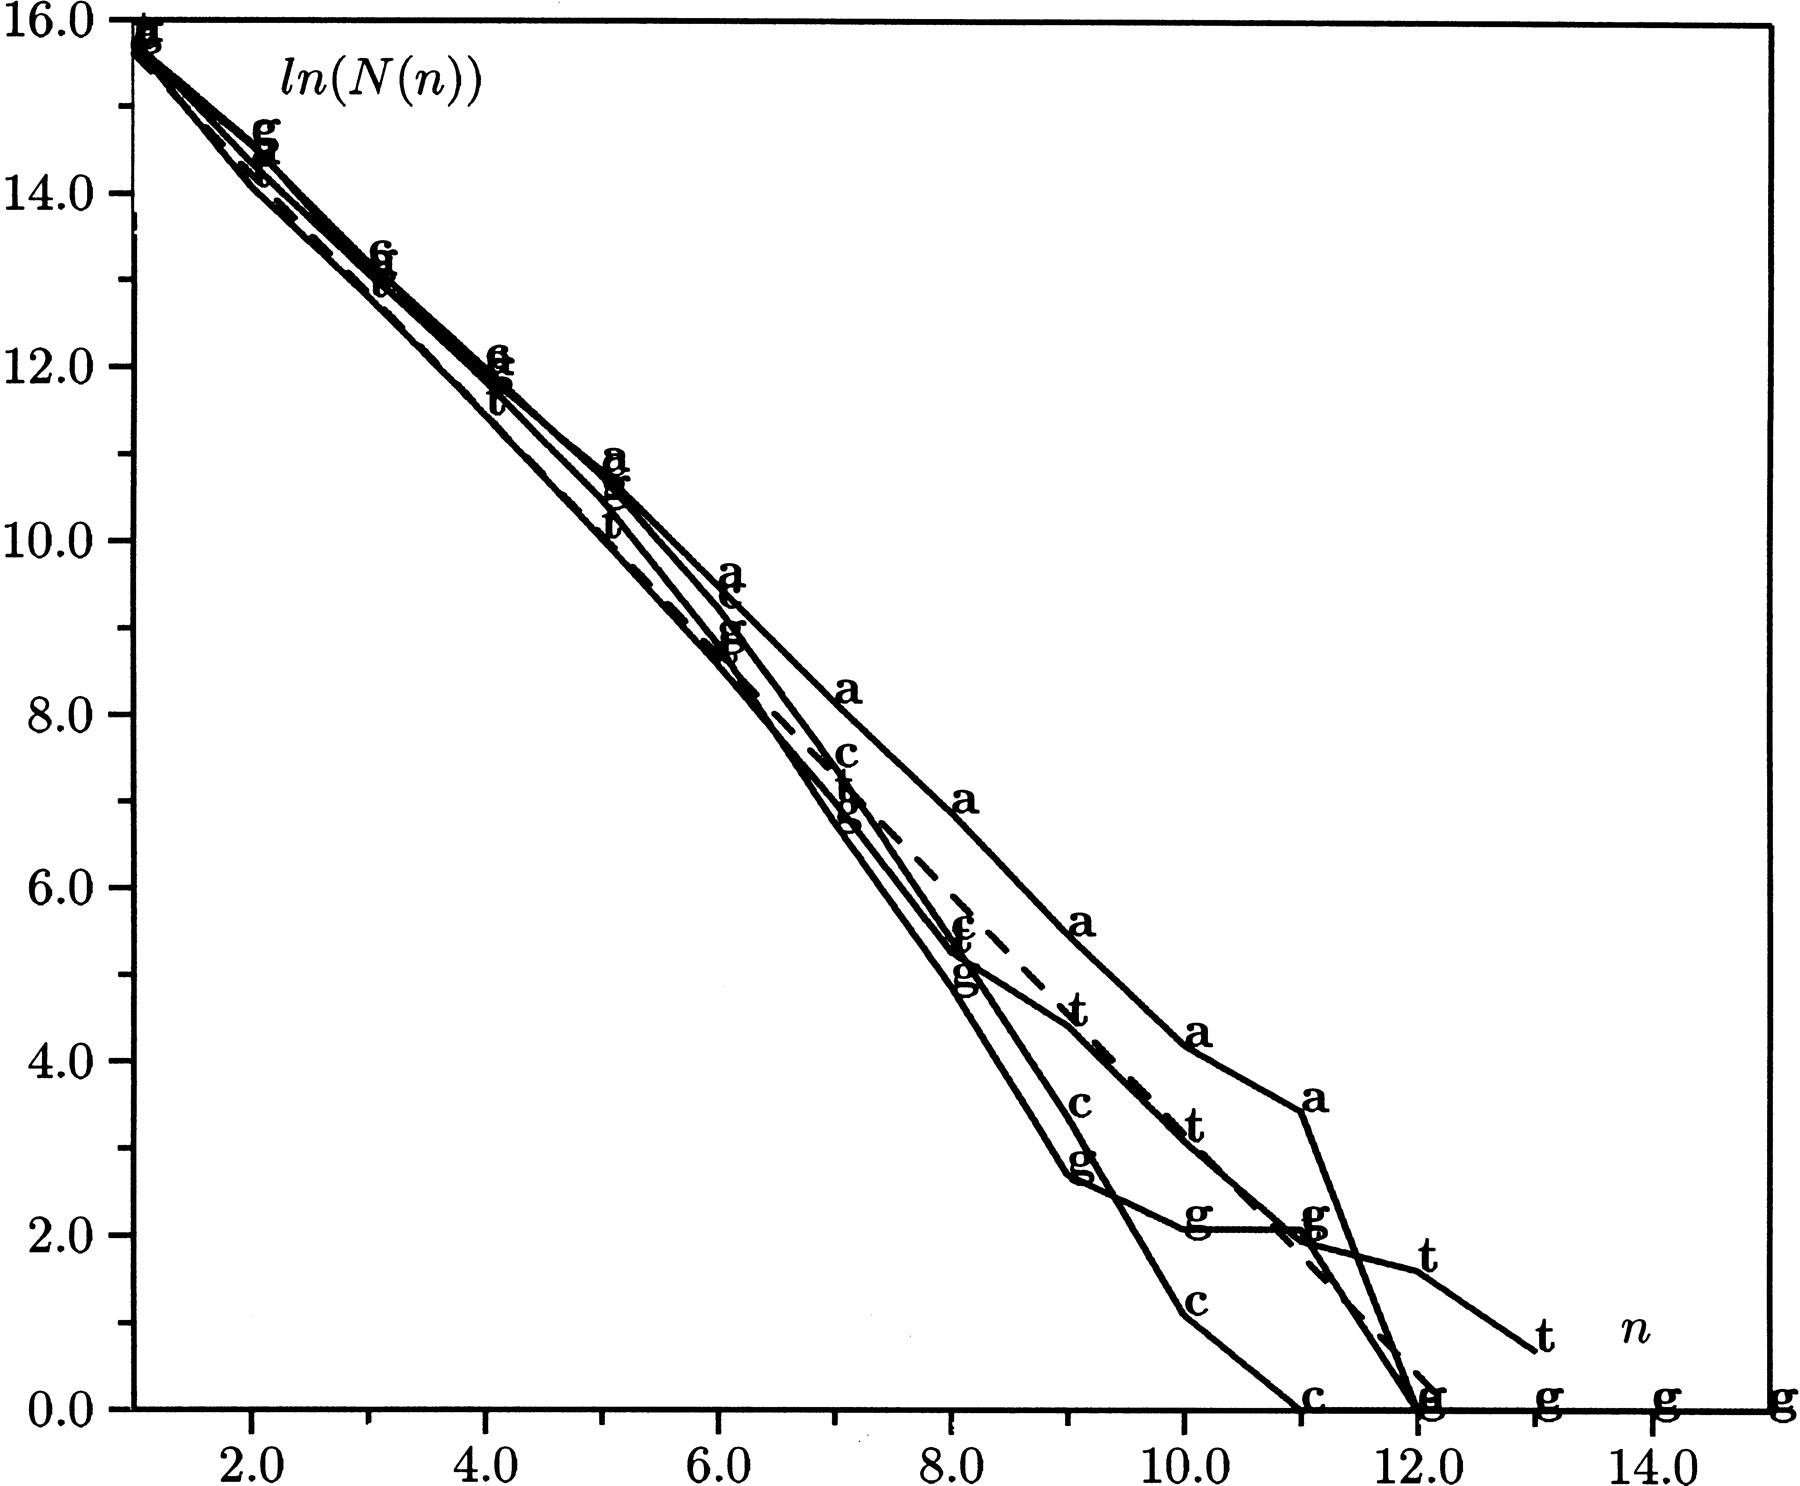
Four histograms displaying the frequency of a, c, g, and t mononucleotide repeats in exons. The dashed line indicates the slope of the histogram of random sequences with equiprobable nucleotide compositions.
Four histograms displaying the frequency of a, c, g, and t mononucleotide repeats in exons. The dashed line indicates the slope of the histogram of random sequences with equiprobable nucleotide compositions.