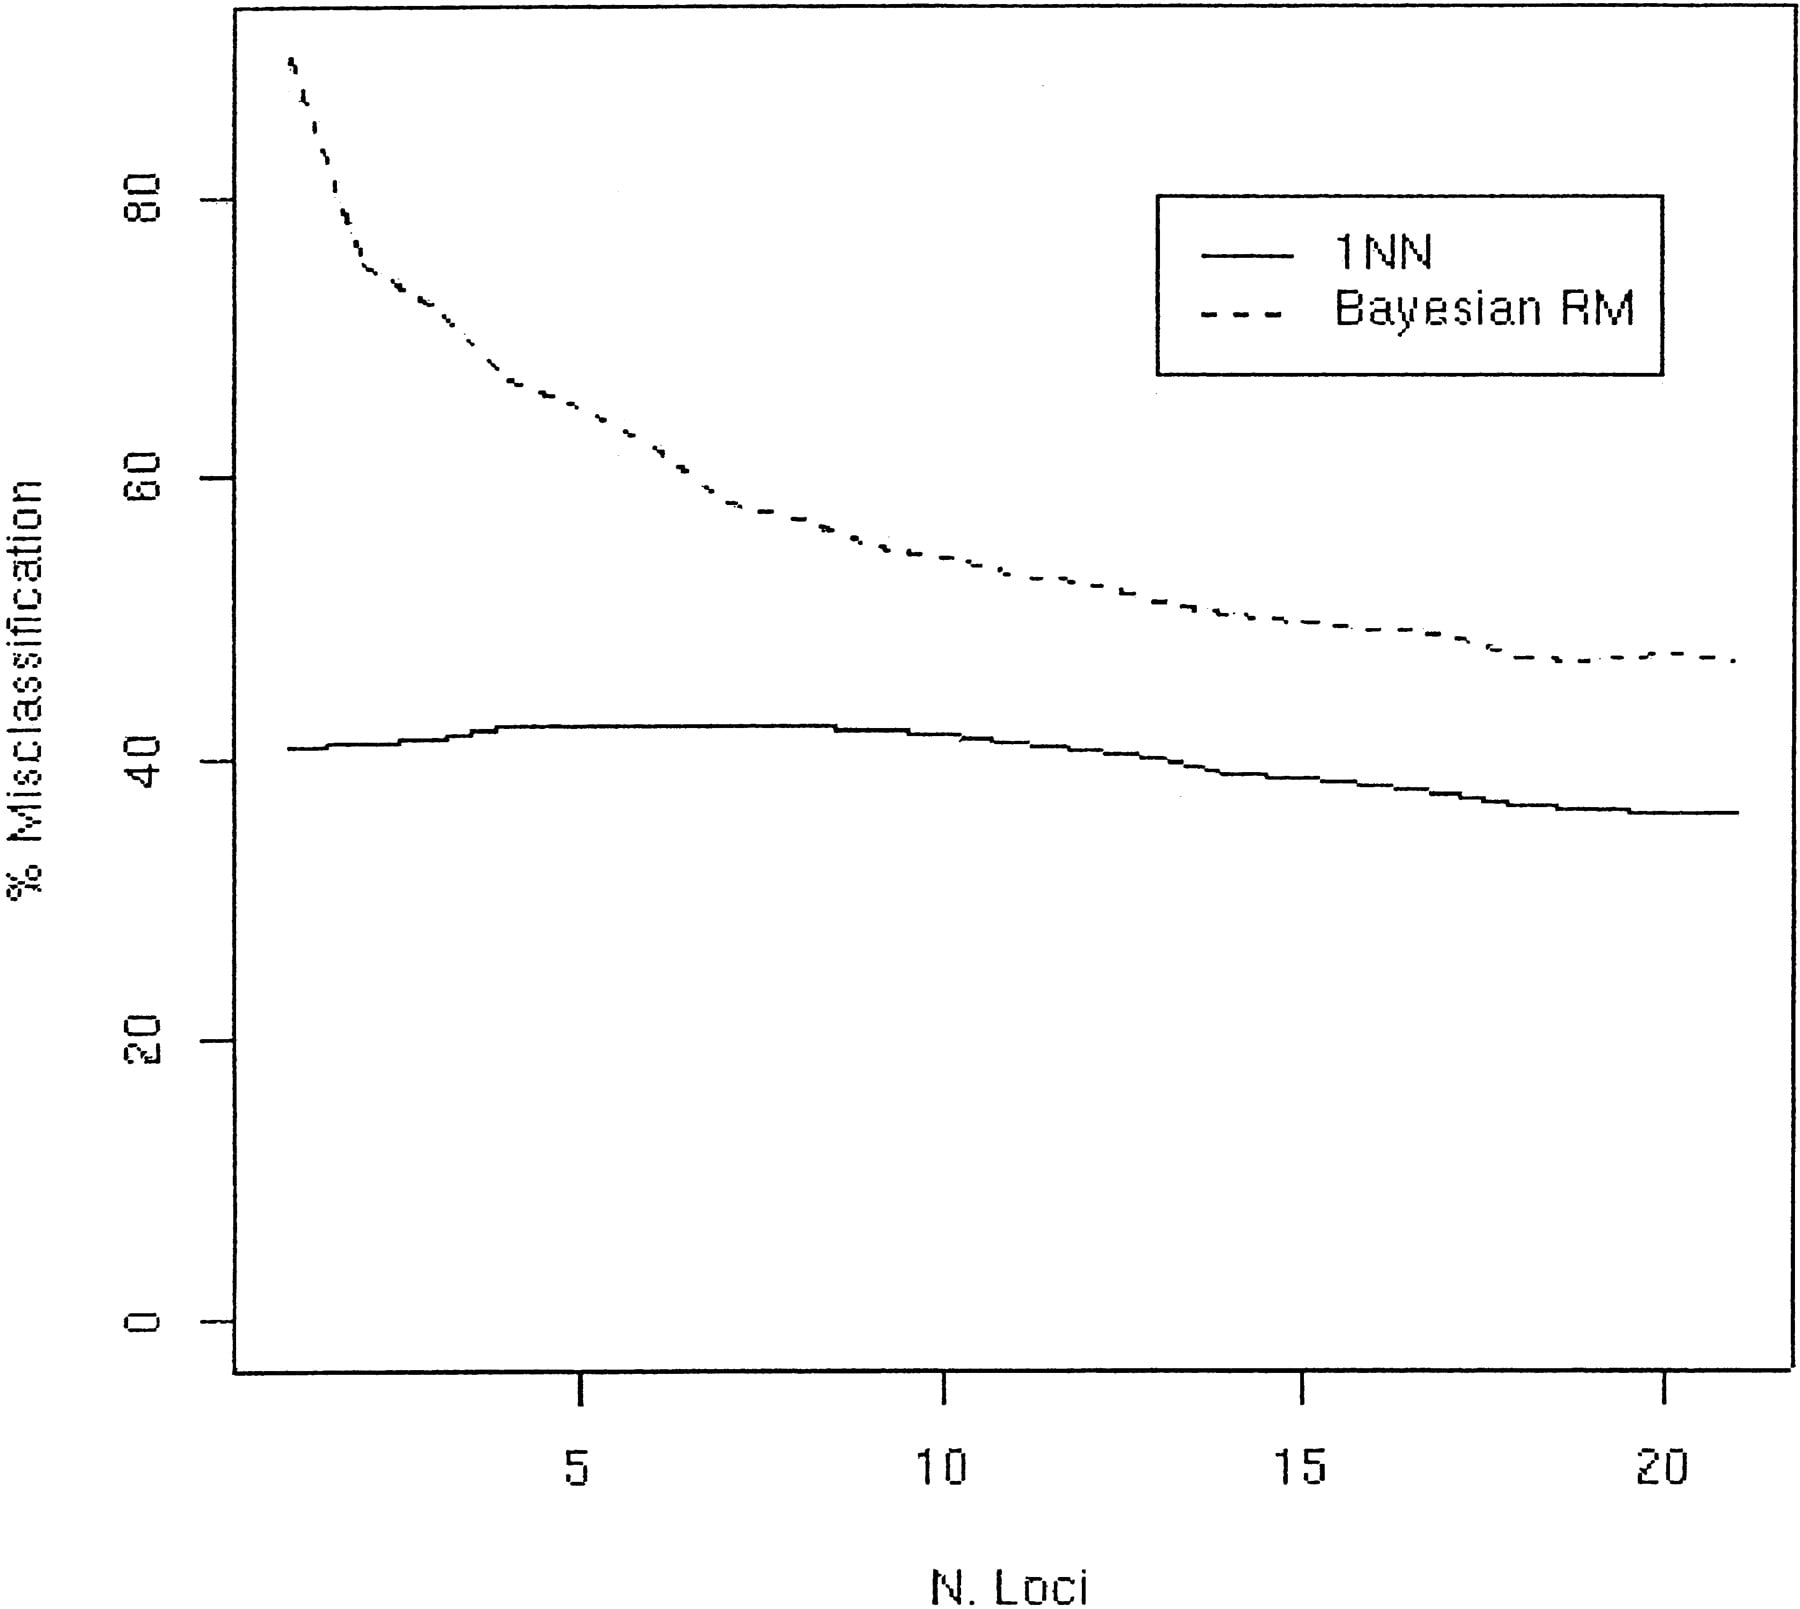
Figure 1.
Relationships between the misclassification rate of the discriminant analysis (Y axis) and the number of loci used for the discrimination (X axis), using two different methods and the Alu21 data set. The graphs represent averages over 500 independent replicates. (Broken line) 1NN, (solid line) RM with Bayesian approach. The loci were added sequentially by Montecarlo randomization, so that their order is not expected to affect the misclassification rate.