Figure 1.
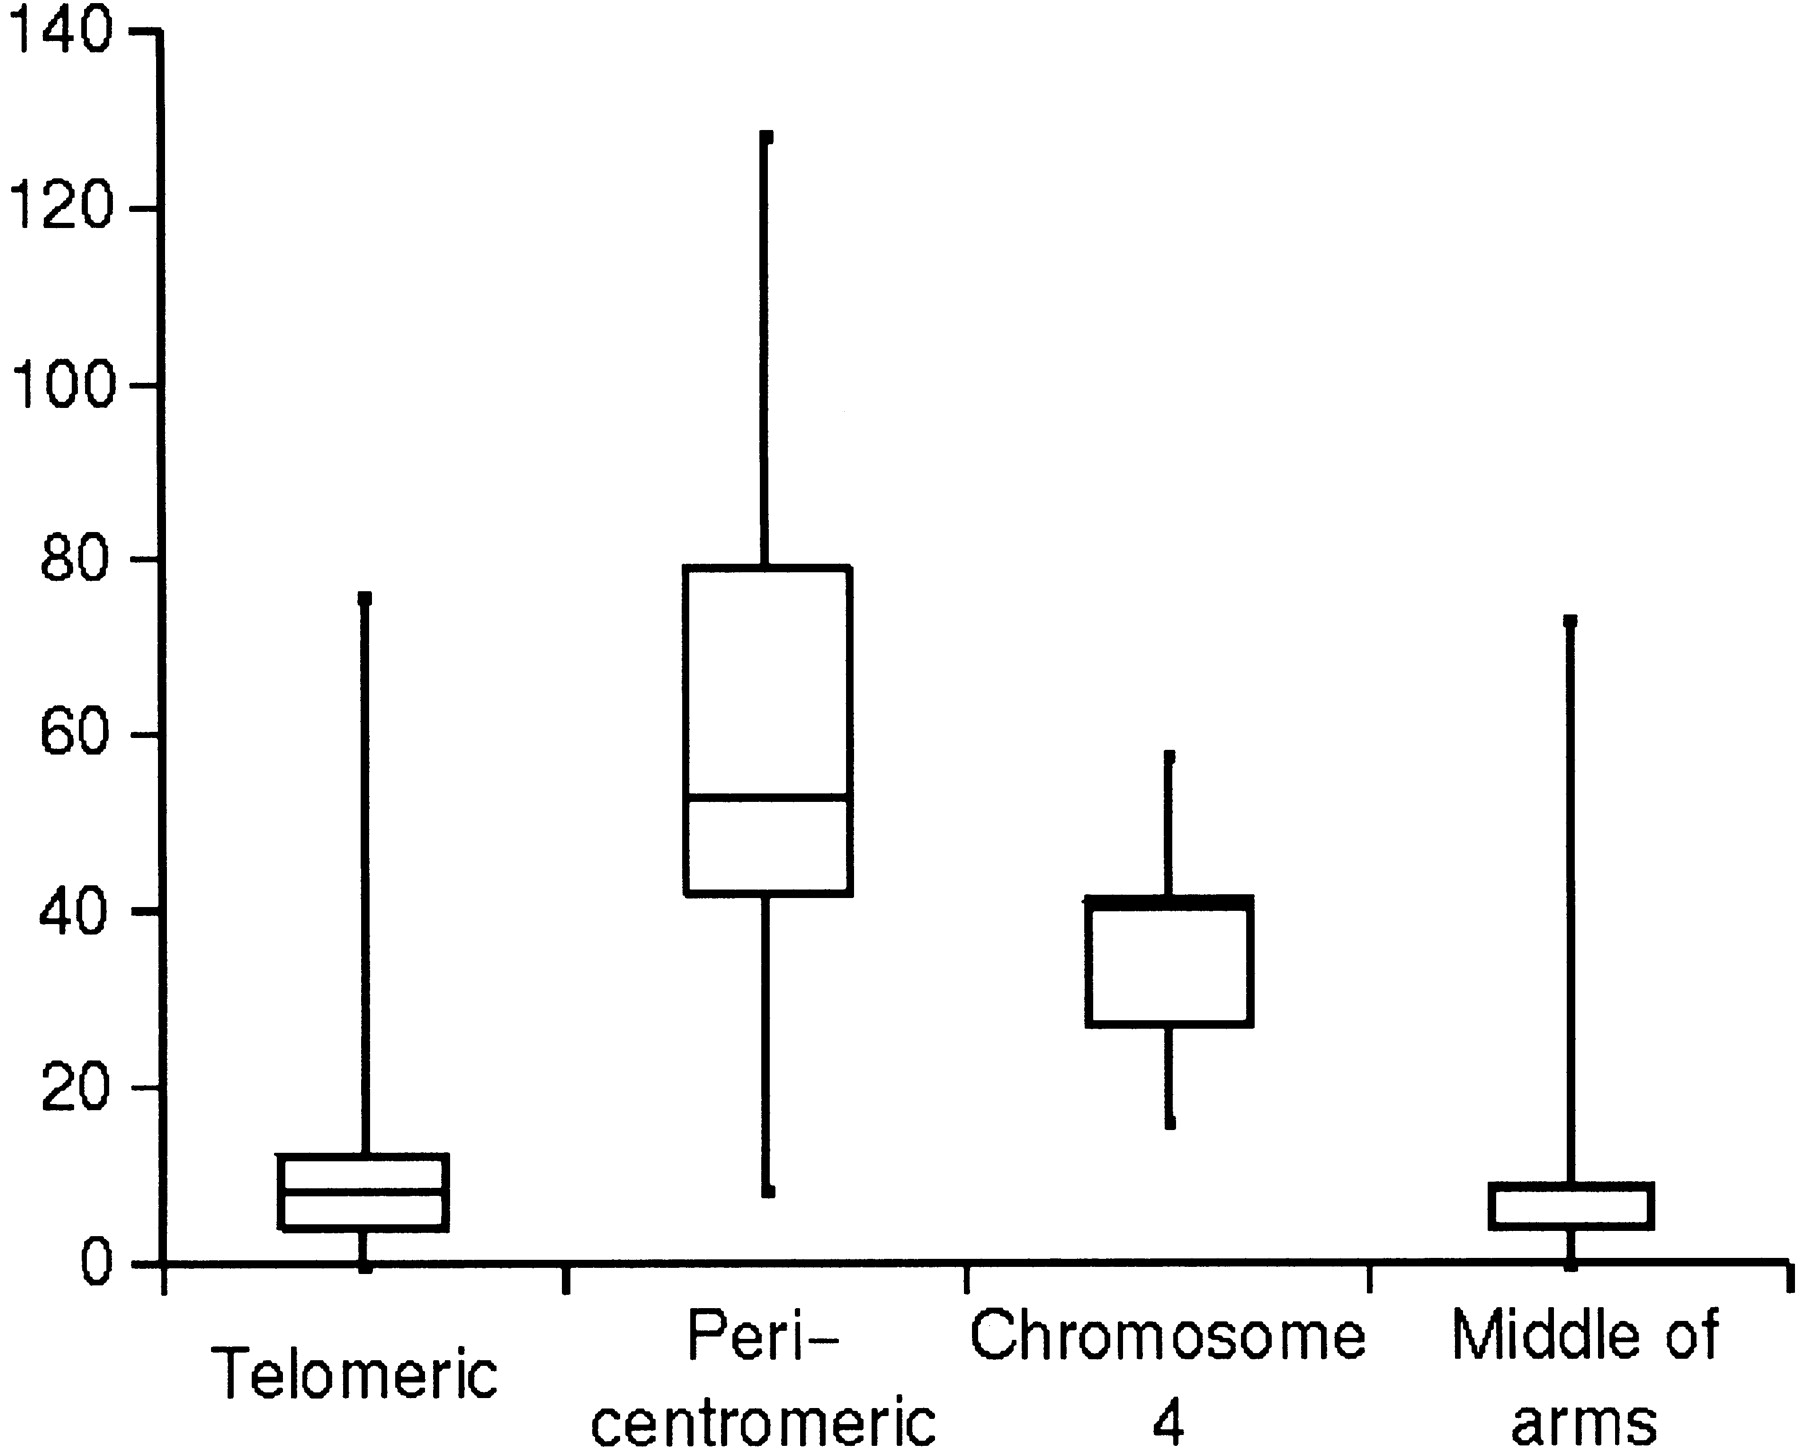
Box diagram of TE densities according to specific chromosomic regions, showing the minimal, quartile 1, median, quartile 3, and maximal values of the TE densities found in 0.25-Mb genome fragments.
Box diagram of TE densities according to specific chromosomic regions, showing the minimal, quartile 1, median, quartile 3, and maximal values of the TE densities found in 0.25-Mb genome fragments.