Figure 1.
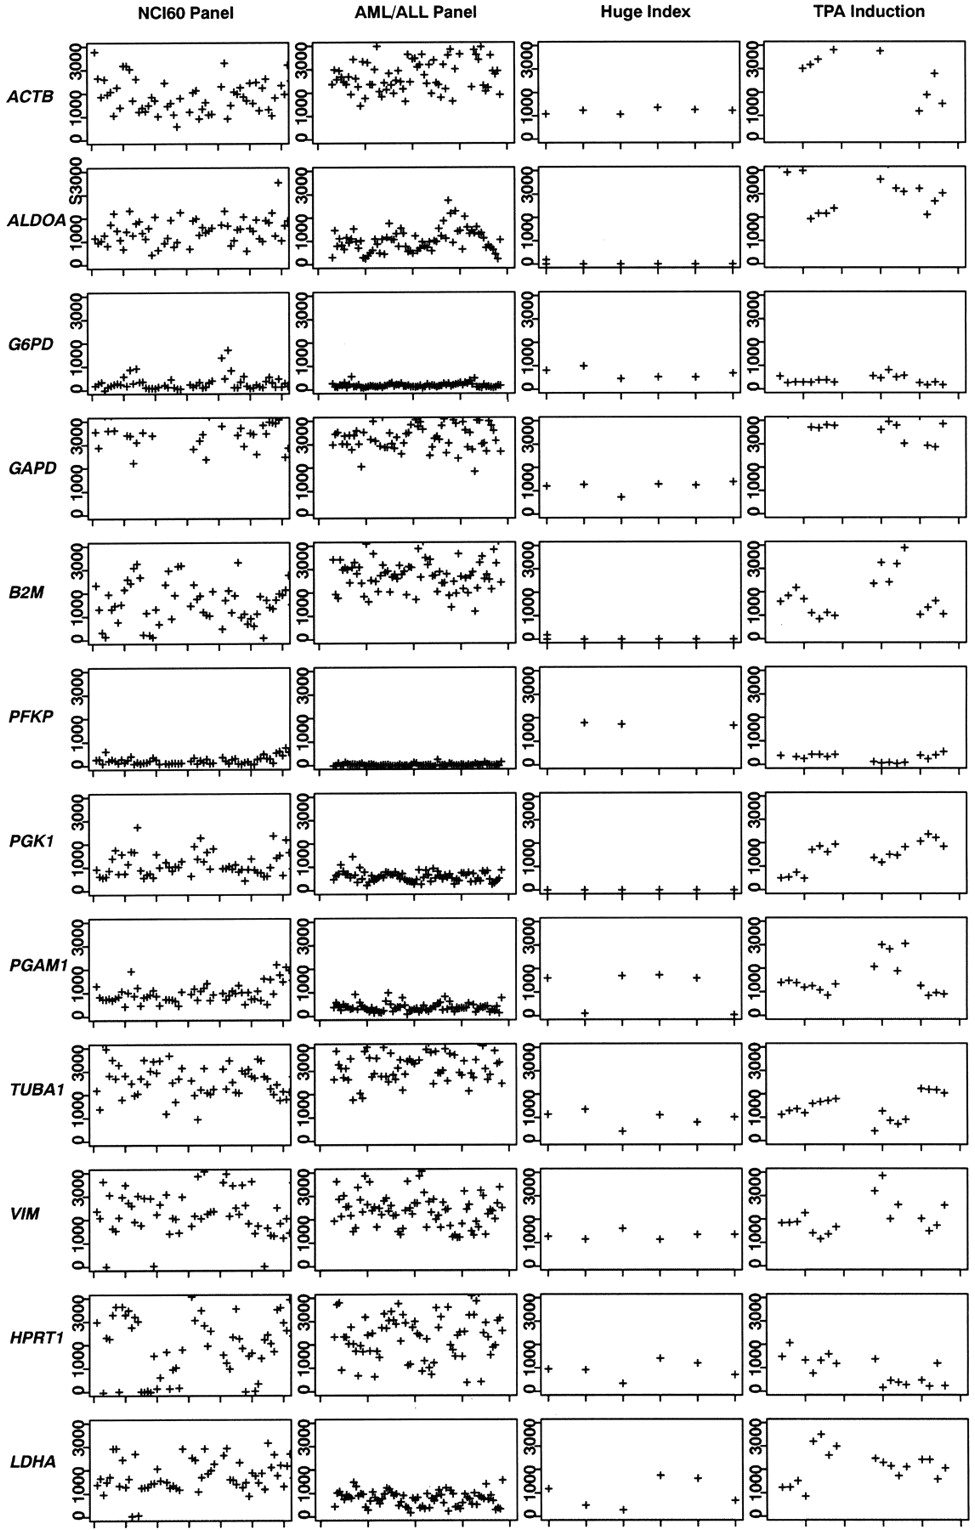
Gene expression profiles of classic control genes examined across multiple datasets: NCI60 cell line panel, ALL/AML tumor panel, Huge Index, and TPA cell-line induction. Gene expression levels uniformly rescaled are plotted on the Y-axis; samples (ordered according to their arrangement given in each respective study) are plotted on theX-axis. All datasets with the exception of the Huge Index were rescaled on the basis of mean intensity per scan.