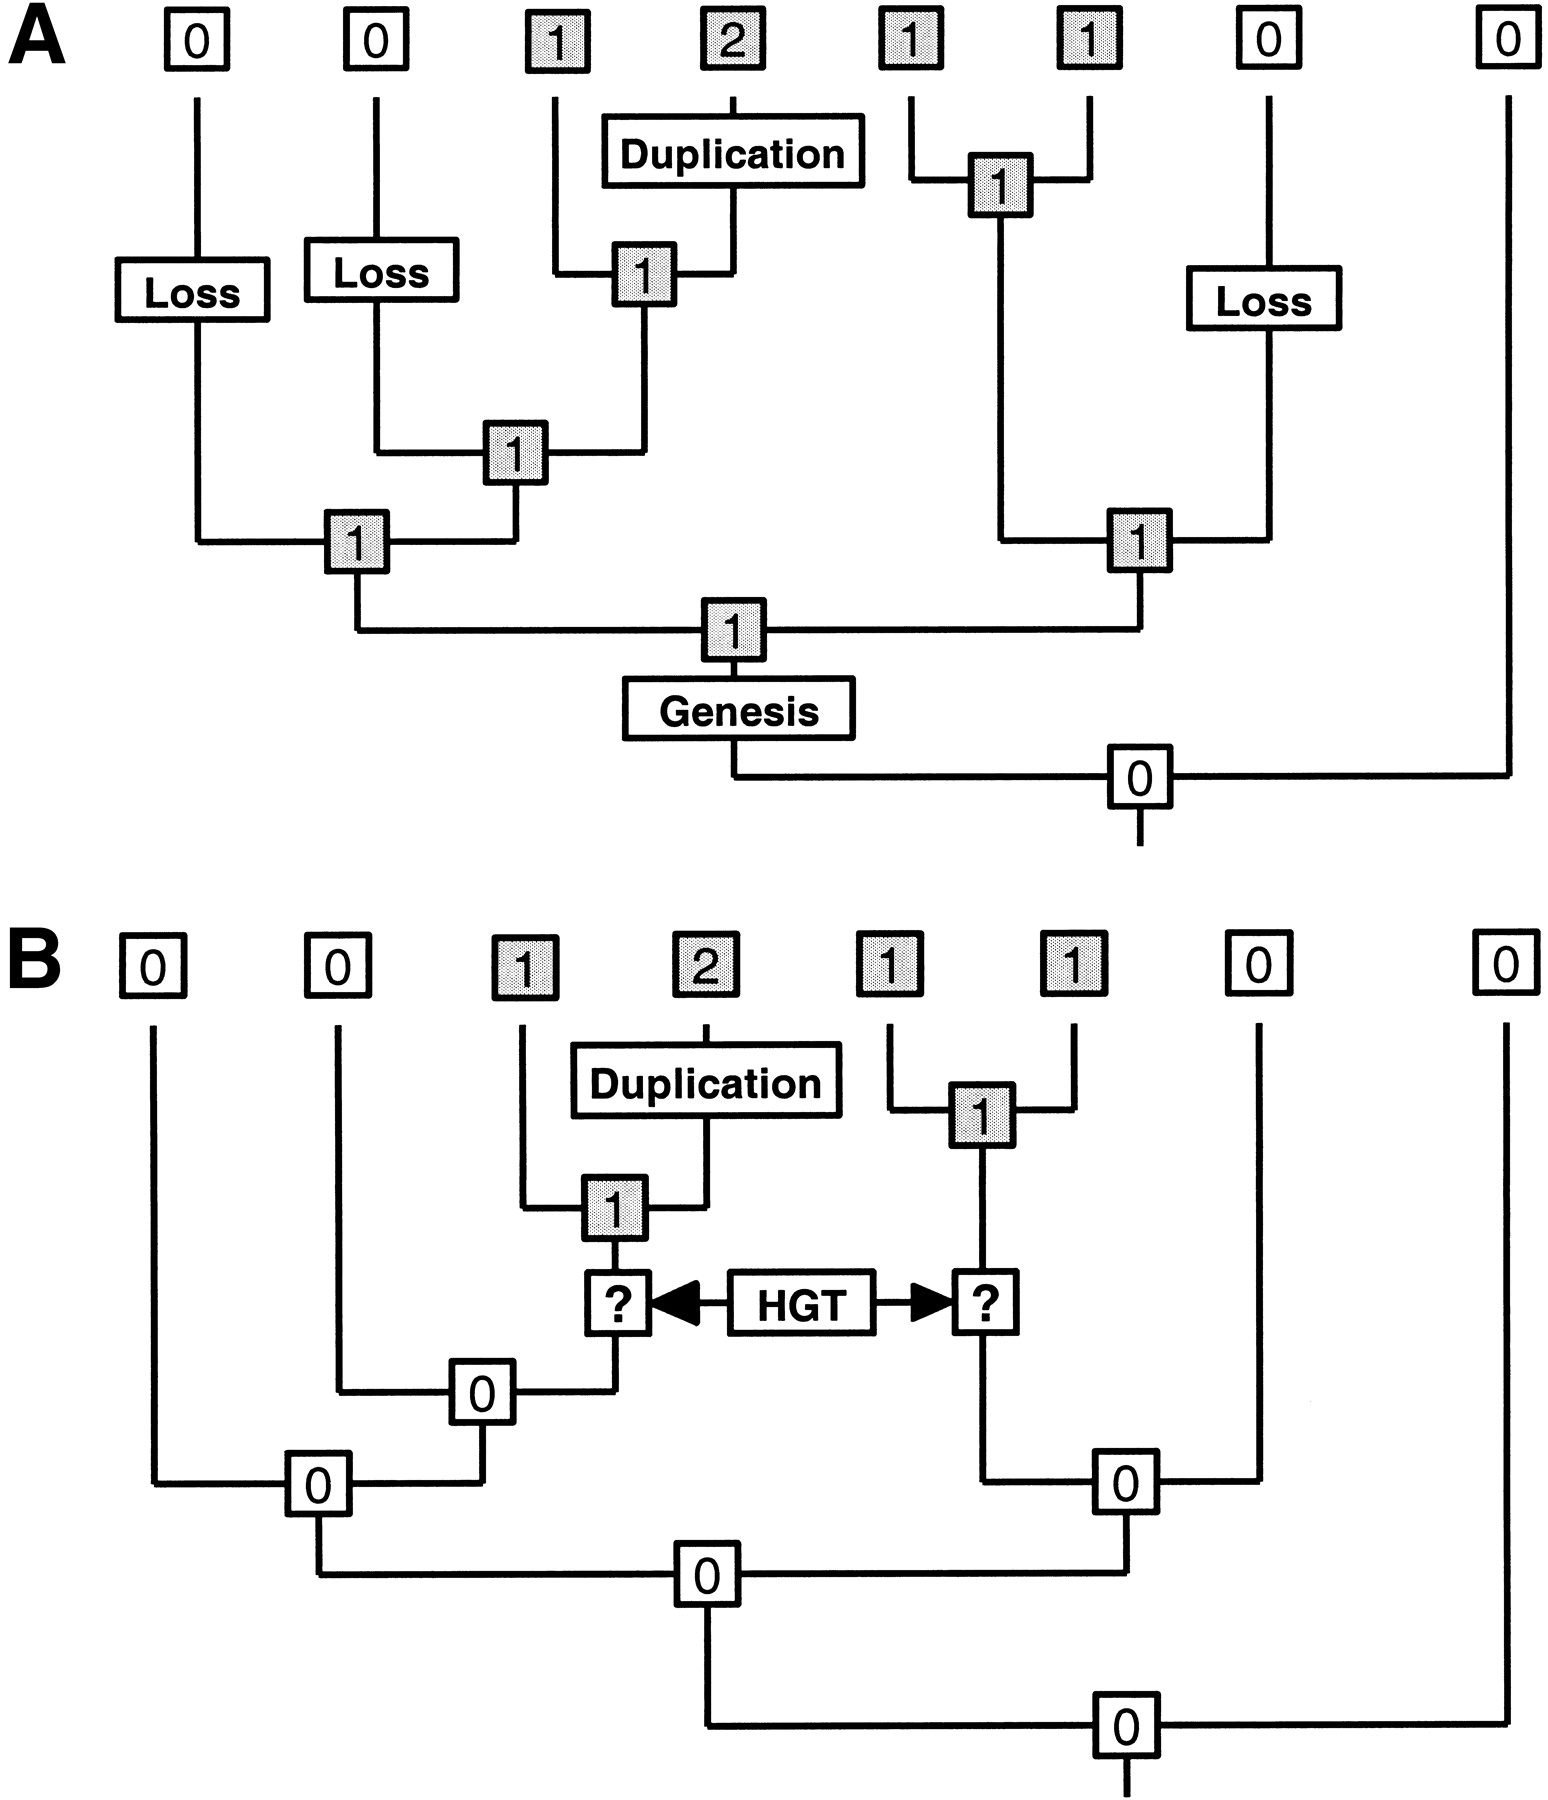
Schematic representation of the procedure used to explain presence patterns in terms of gene genesis, gene loss, gene duplication, and HGT. Panels A and B show the same species topology with the same present day presence pattern of a group of orthologs. The gray boxes with a “1” or “2” indicate that a gene from the group of orthologs is present one or two times, while the white boxes with the “0” indicate that the group is absent from that node. Panel A depicts, based on this distribution, what we infer about the presence of genes in the ancestral nodes assuming only vertical inheritance and using the minimum number of events necessary. It also shows where we determine gene genesis, gene duplication, and gene loss to have occurred based on this ancestral distribution pattern. Panel B shows how the same pattern can be explained by one duplication (the same as in A), one genesis, and one HGT. The boxes with question marks indicate that along one branch an HGT and along the other a gene genesis occurred, but we are unable to say which occurred where. Thus a question mark denotes either a gene genesis or the acceptance of a horizontally transferred gene. At an HGT penalty lower than 3, we explain the distribution of this orthologous group in terms of horizontal transfer, and at an HGT penalty higher or equal to 3 we explain the same distribution in terms of multiple losses.