Figure 1.
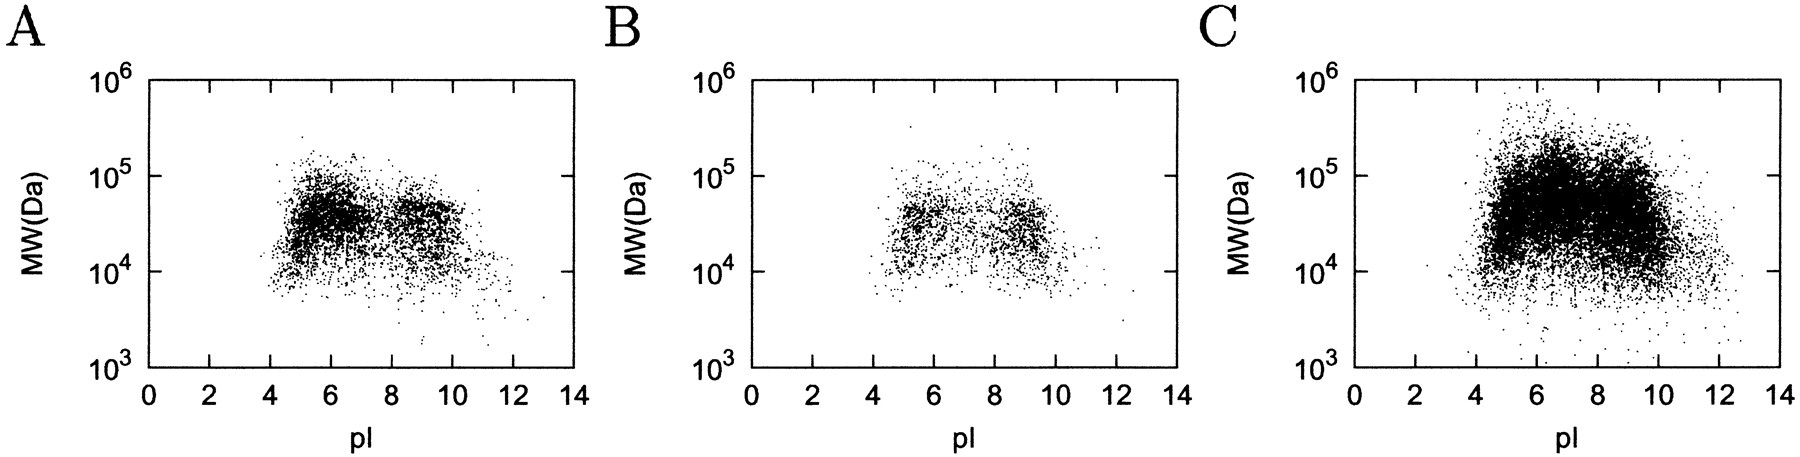
Scatter plots of estimated molecular mass versus pI for (A)Escherichia coli K12–, (B) Methanococcus jannaschii–, and (C) Drosophila melanogaster–predicted ORFs.
Scatter plots of estimated molecular mass versus pI for (A)Escherichia coli K12–, (B) Methanococcus jannaschii–, and (C) Drosophila melanogaster–predicted ORFs.