Figure 1.
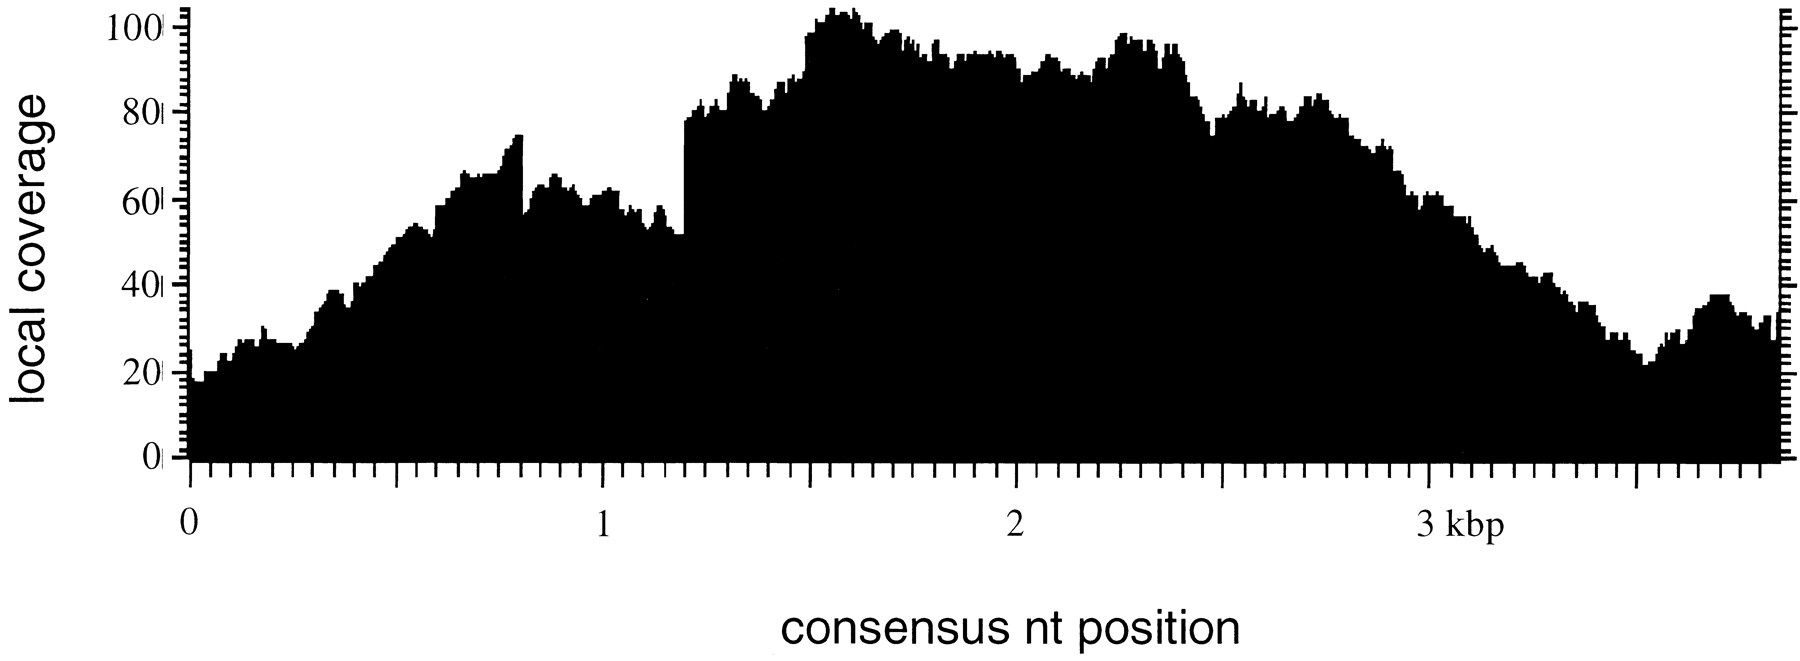
Coverage plot for element family Tdd-4 deduced from an alignment of 550 randomly chosen reads using CLUSTALW. Each base of the alignment is represented by a dot.
Coverage plot for element family Tdd-4 deduced from an alignment of 550 randomly chosen reads using CLUSTALW. Each base of the alignment is represented by a dot.