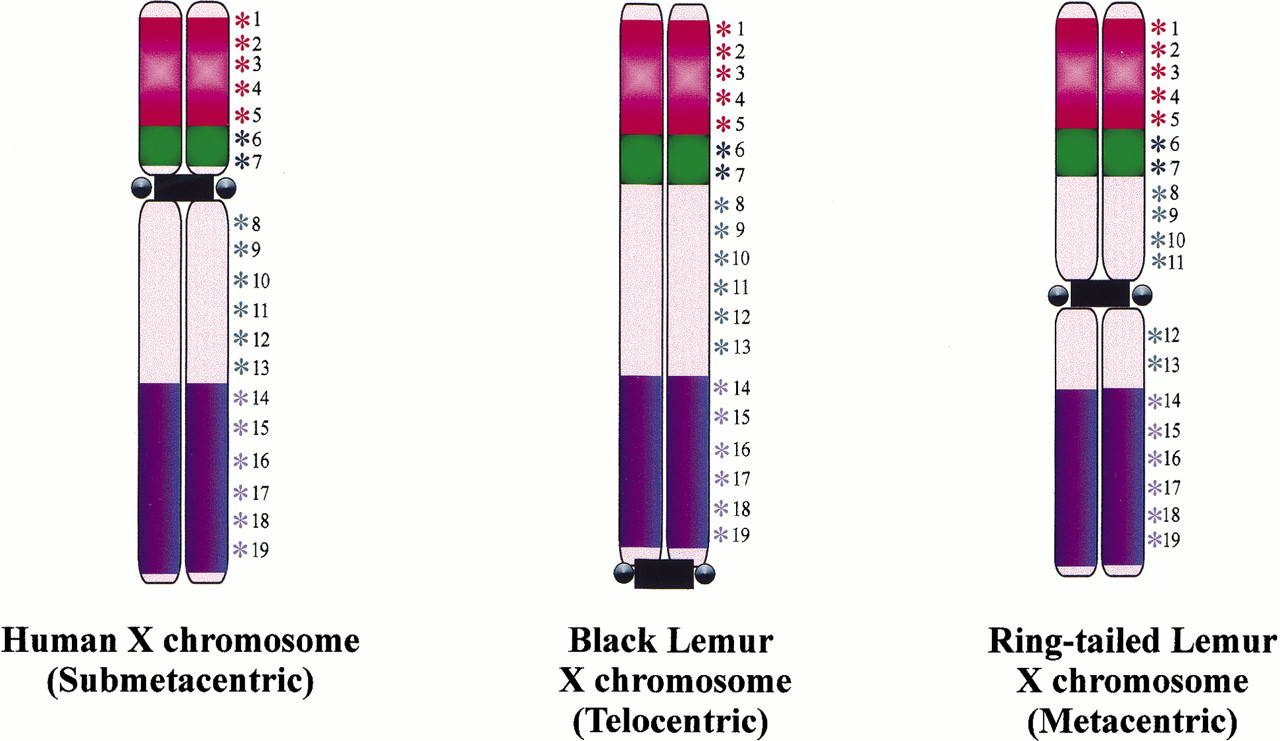
Figure 1.
FISH mapping showing centromere repositioning on the X chromosomes of three different primate species. Centromere position is indicated by the black box. Colored asterisks, numbered 1–19, represent positions of the different BAC or cosmid probes used in FISH mapping analysis. Subchromosomal paints are indicated by the regions shown in red, green, or purple. Despite the different positions of the centromeres, all three chromosomes are found to be isosequential.