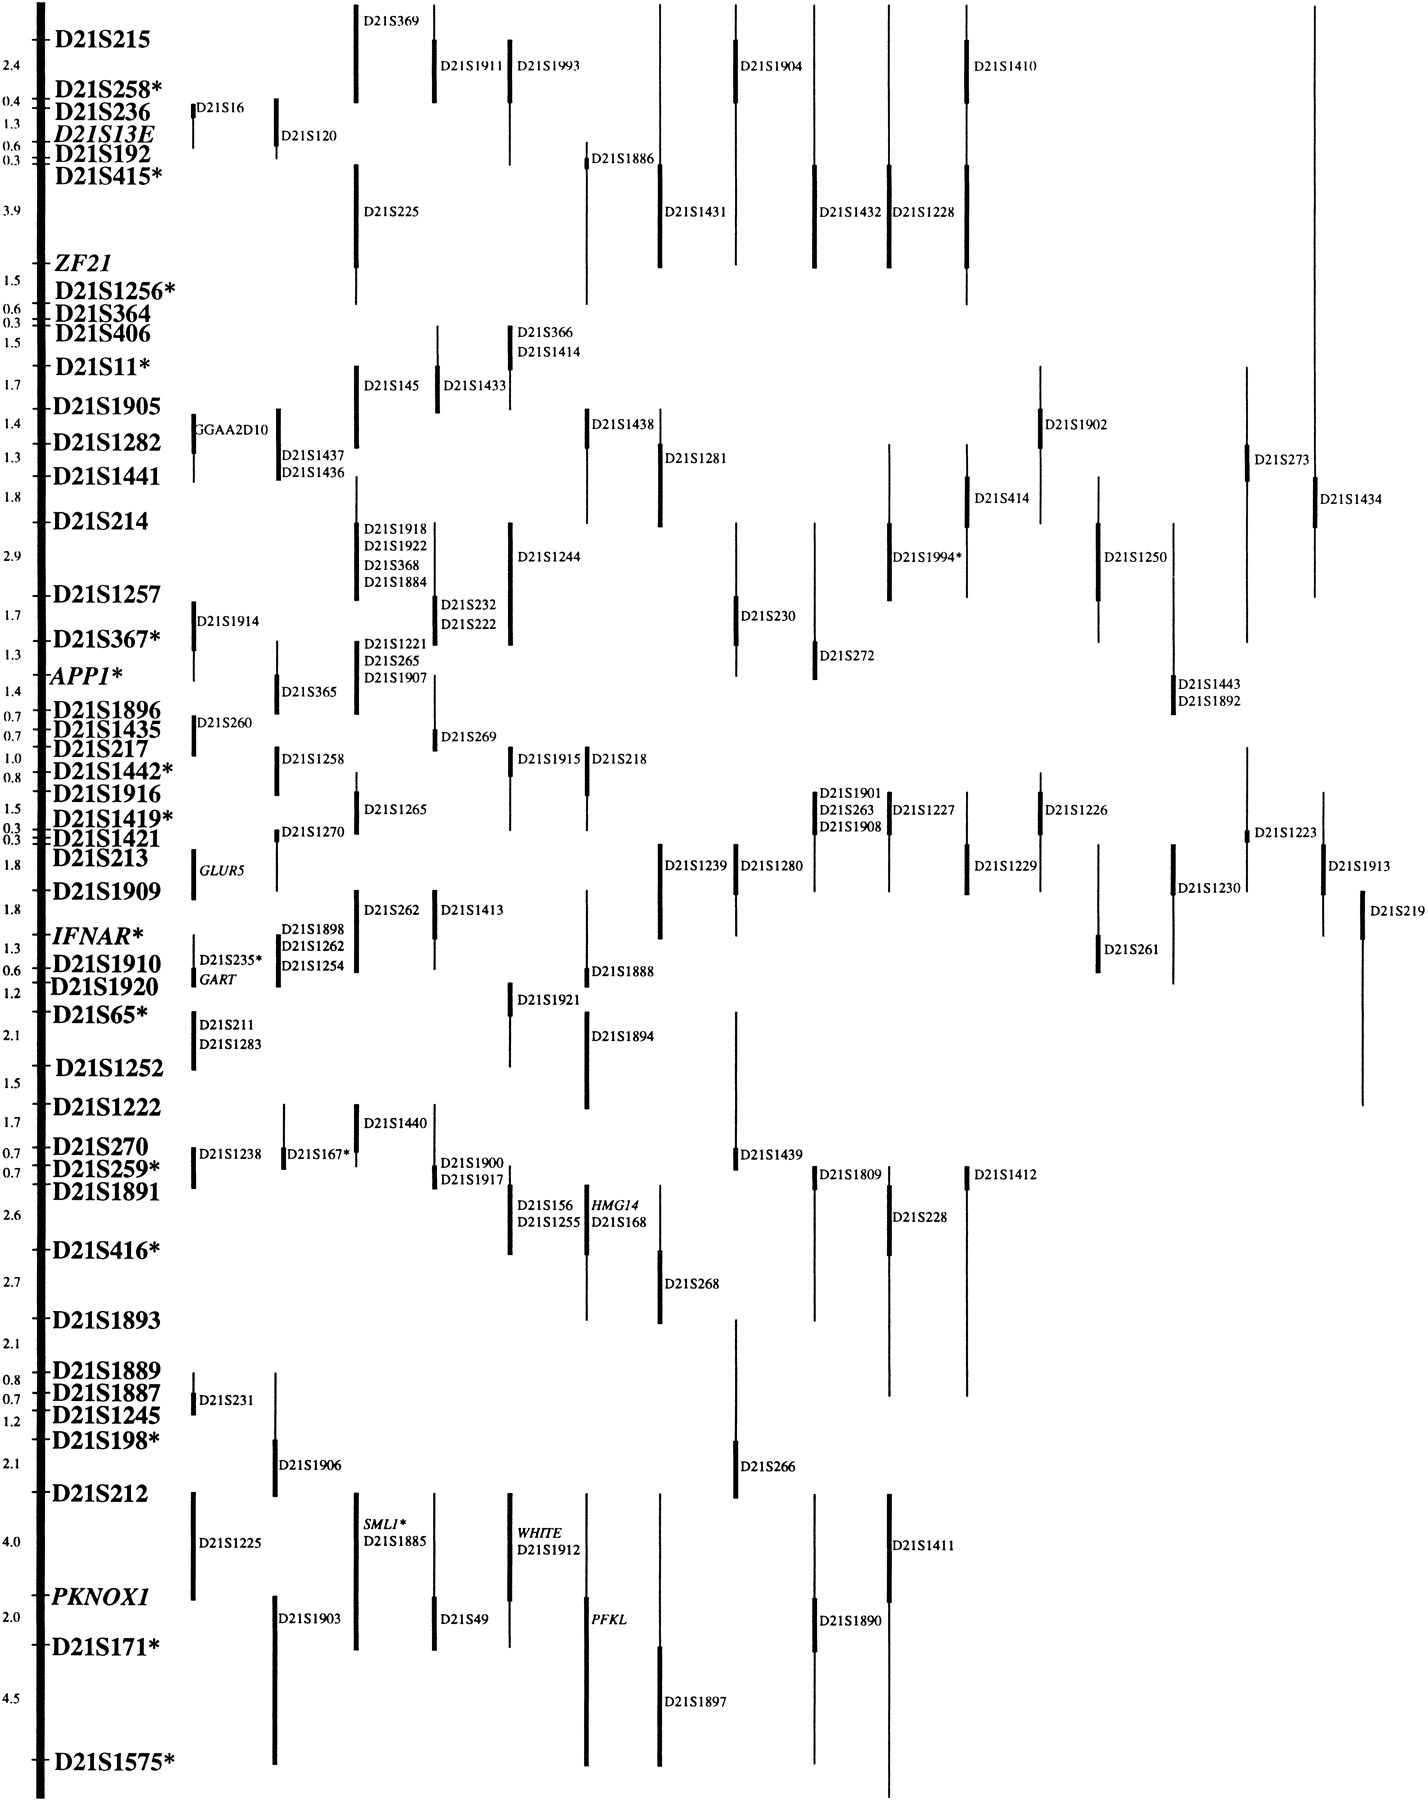
Figure 1.
Genetic linkage map of human chromosome 21q. The comprehensive 21q genetic linkage map with markers mapped at odds of 1000:1 or greater is depicted on the left, with sex-averaged intermarker distances in cM. Additional loci are shown in their 1000:1 odds location to the right of the map, with the most likely interval indicated by the thickest bar. Markers indicated in italics represent known expressed sequences; the remainder are anonymous sequences. Marker names followed by an asterisk (*) indicate a haplotyped megalocus, as defined in the Methods.