Skip to main content
Figure 1.
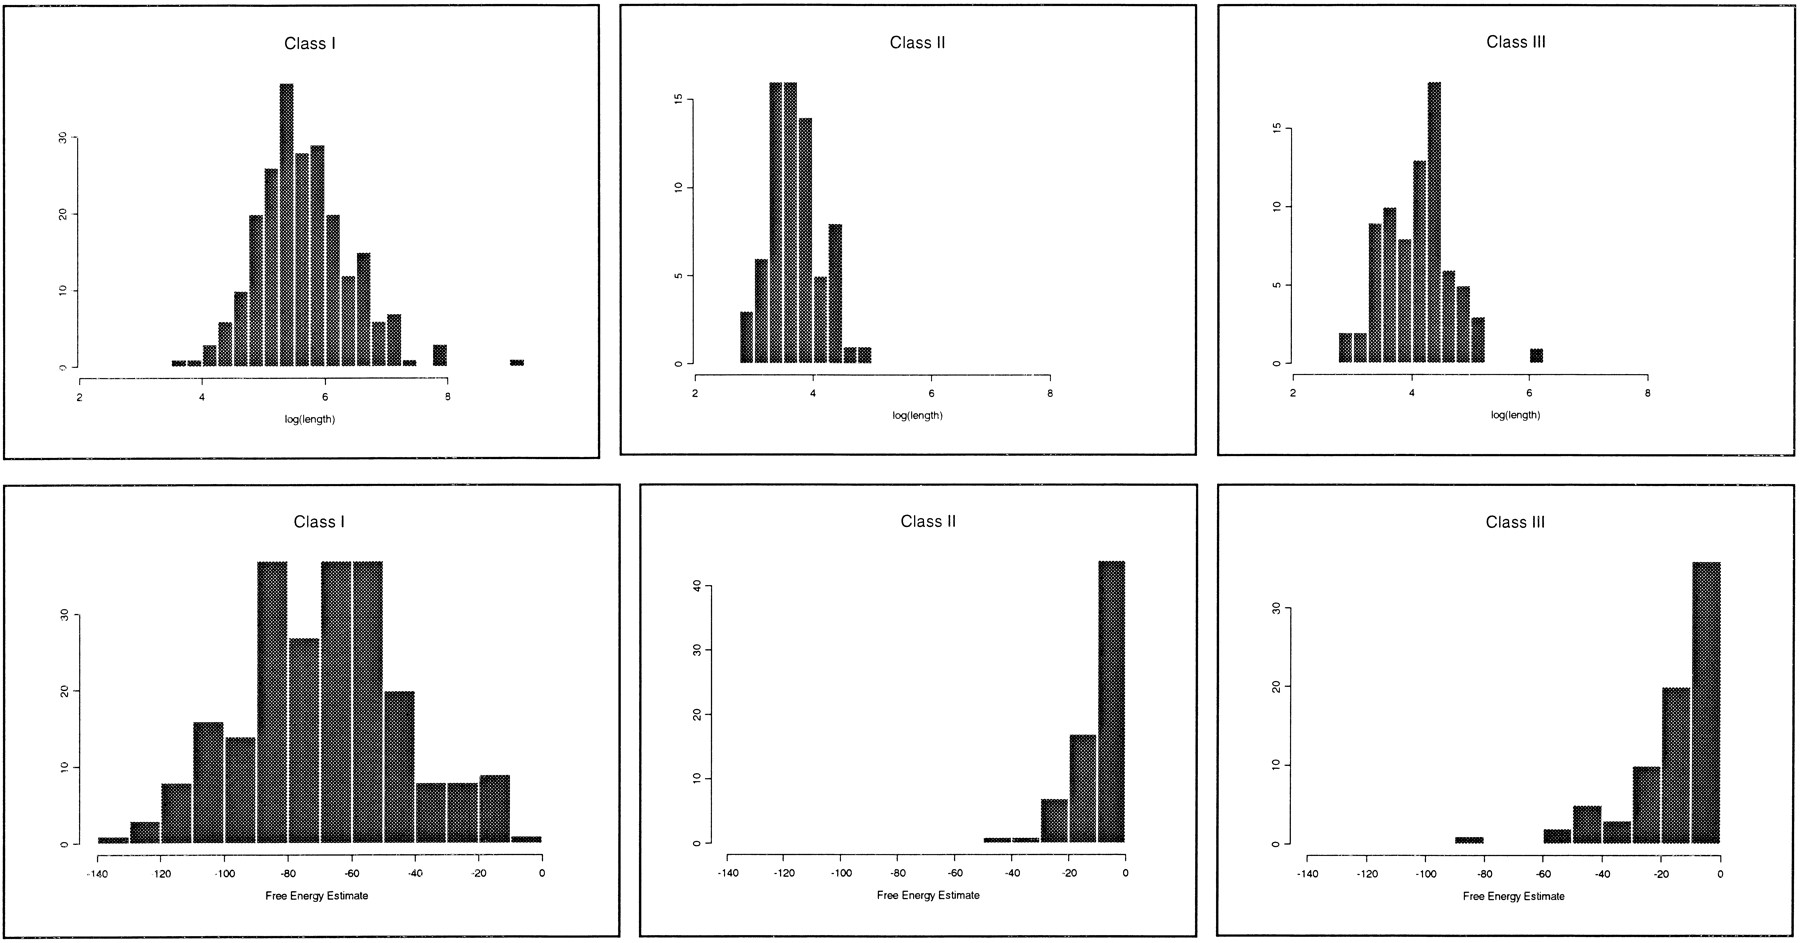
(
Top
) 5′ UTR length distributions. (
Bottom
) Free energy distributions (ΔG in kcal/mole).