(Continued)
(Continued)
(Continued)
(Continued)
(Continued)
(Continues on pp 1513–1518)
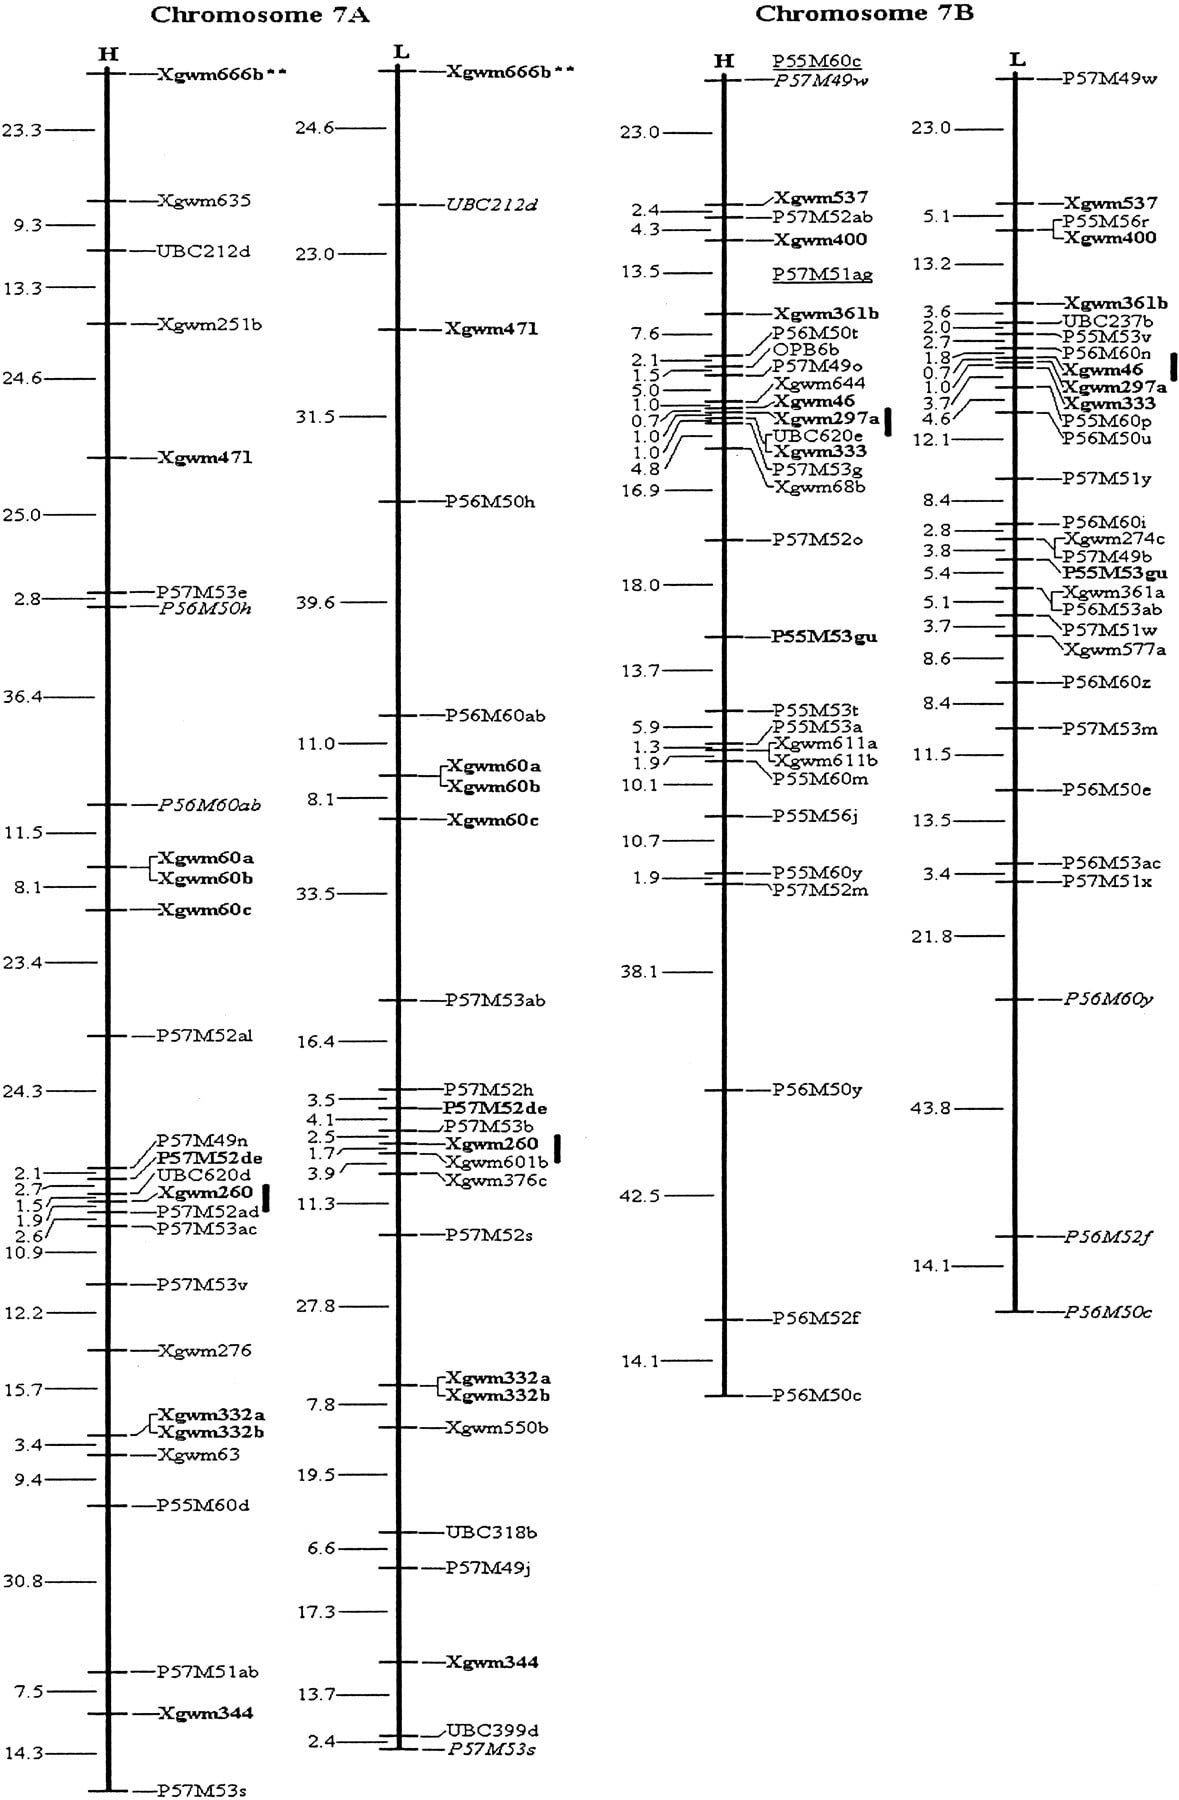
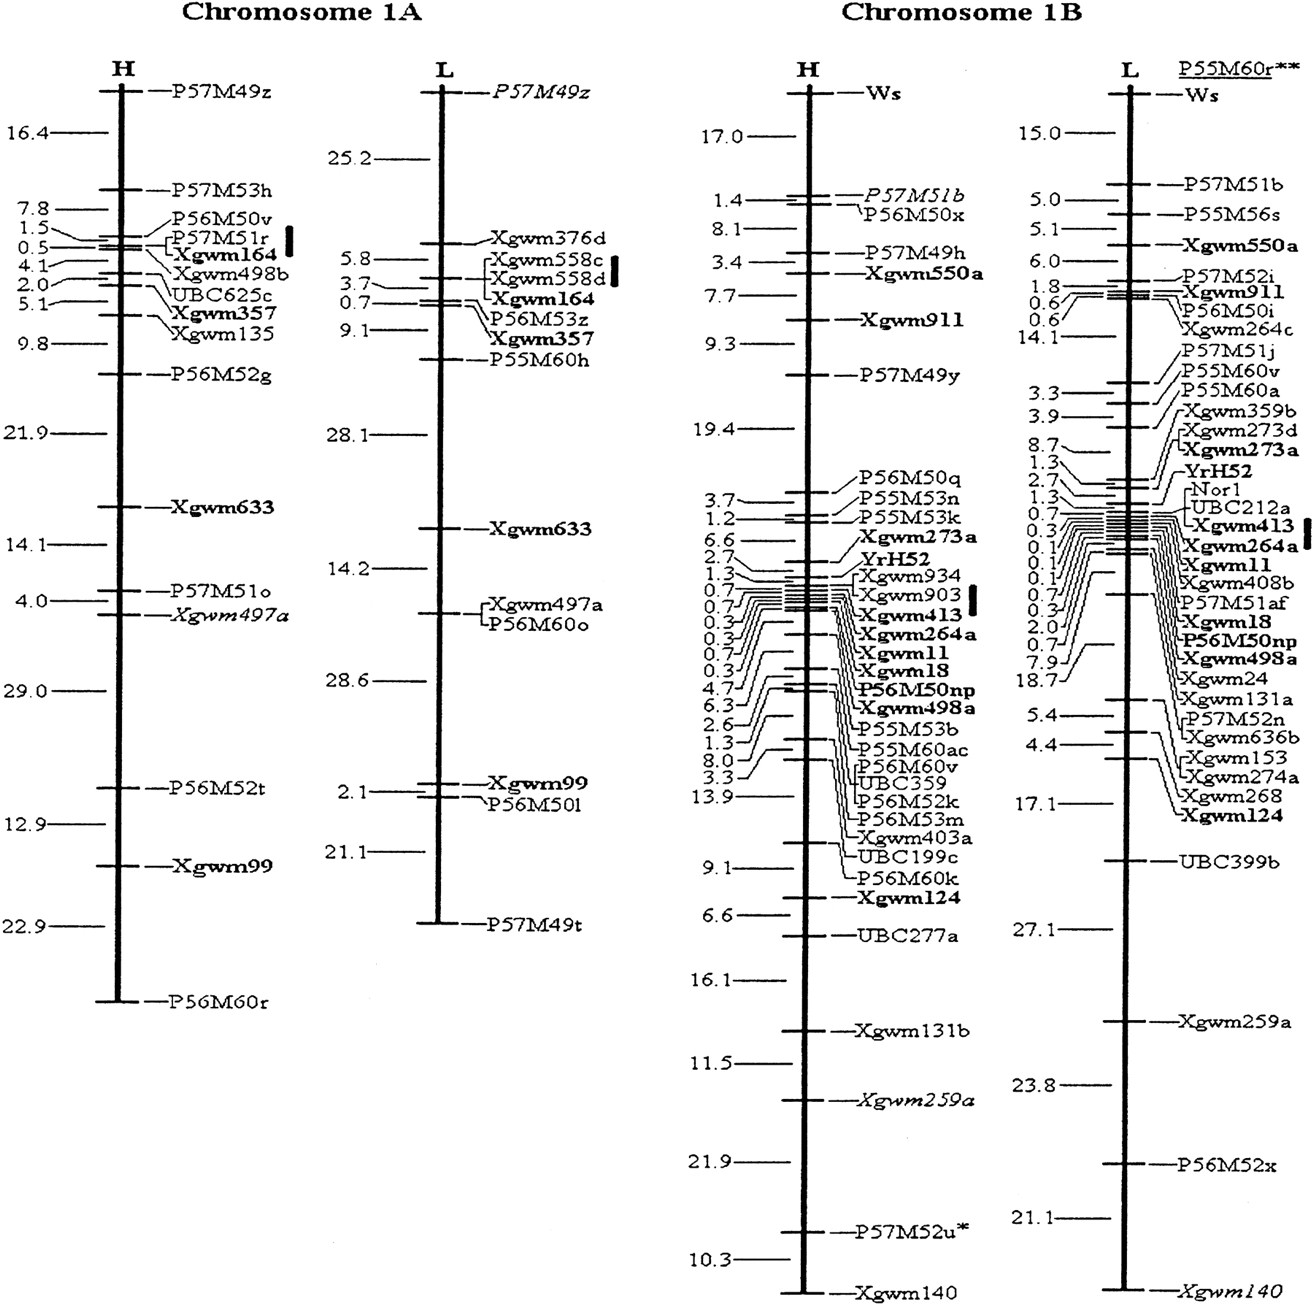
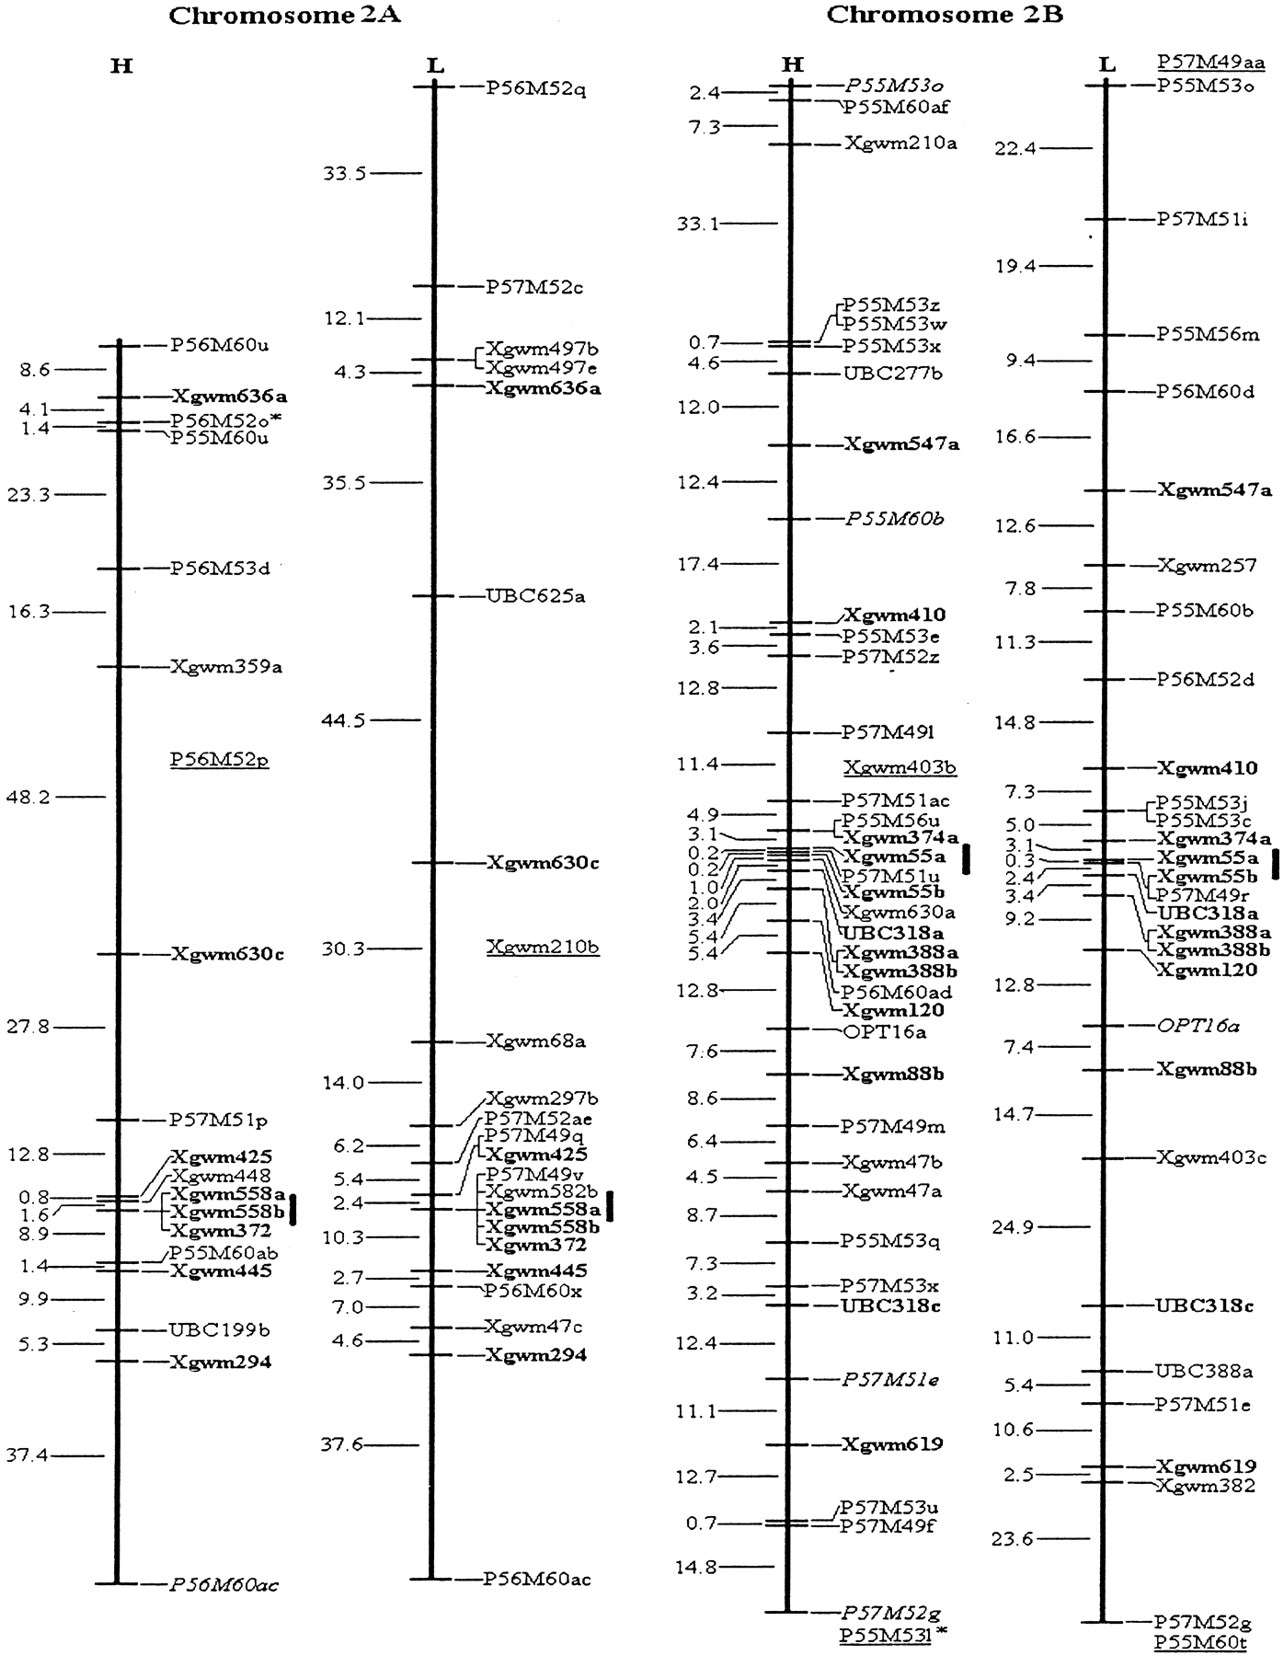
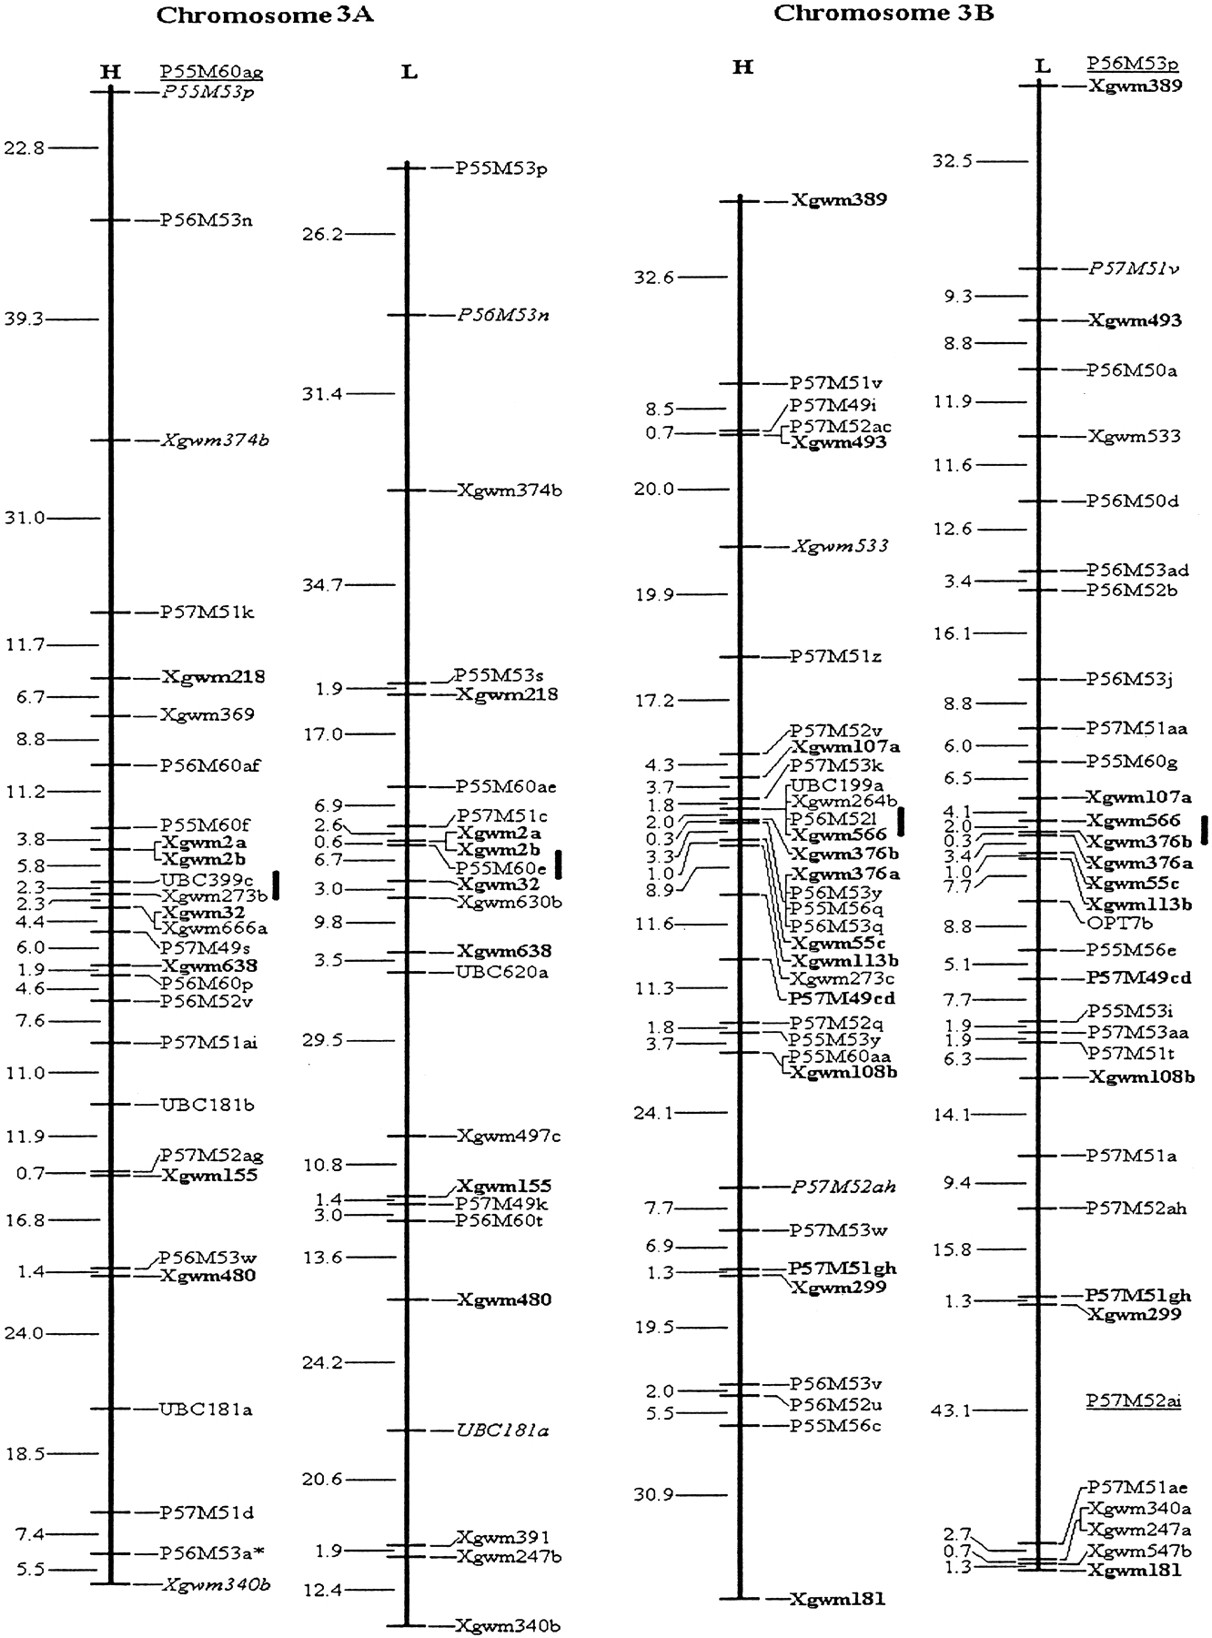
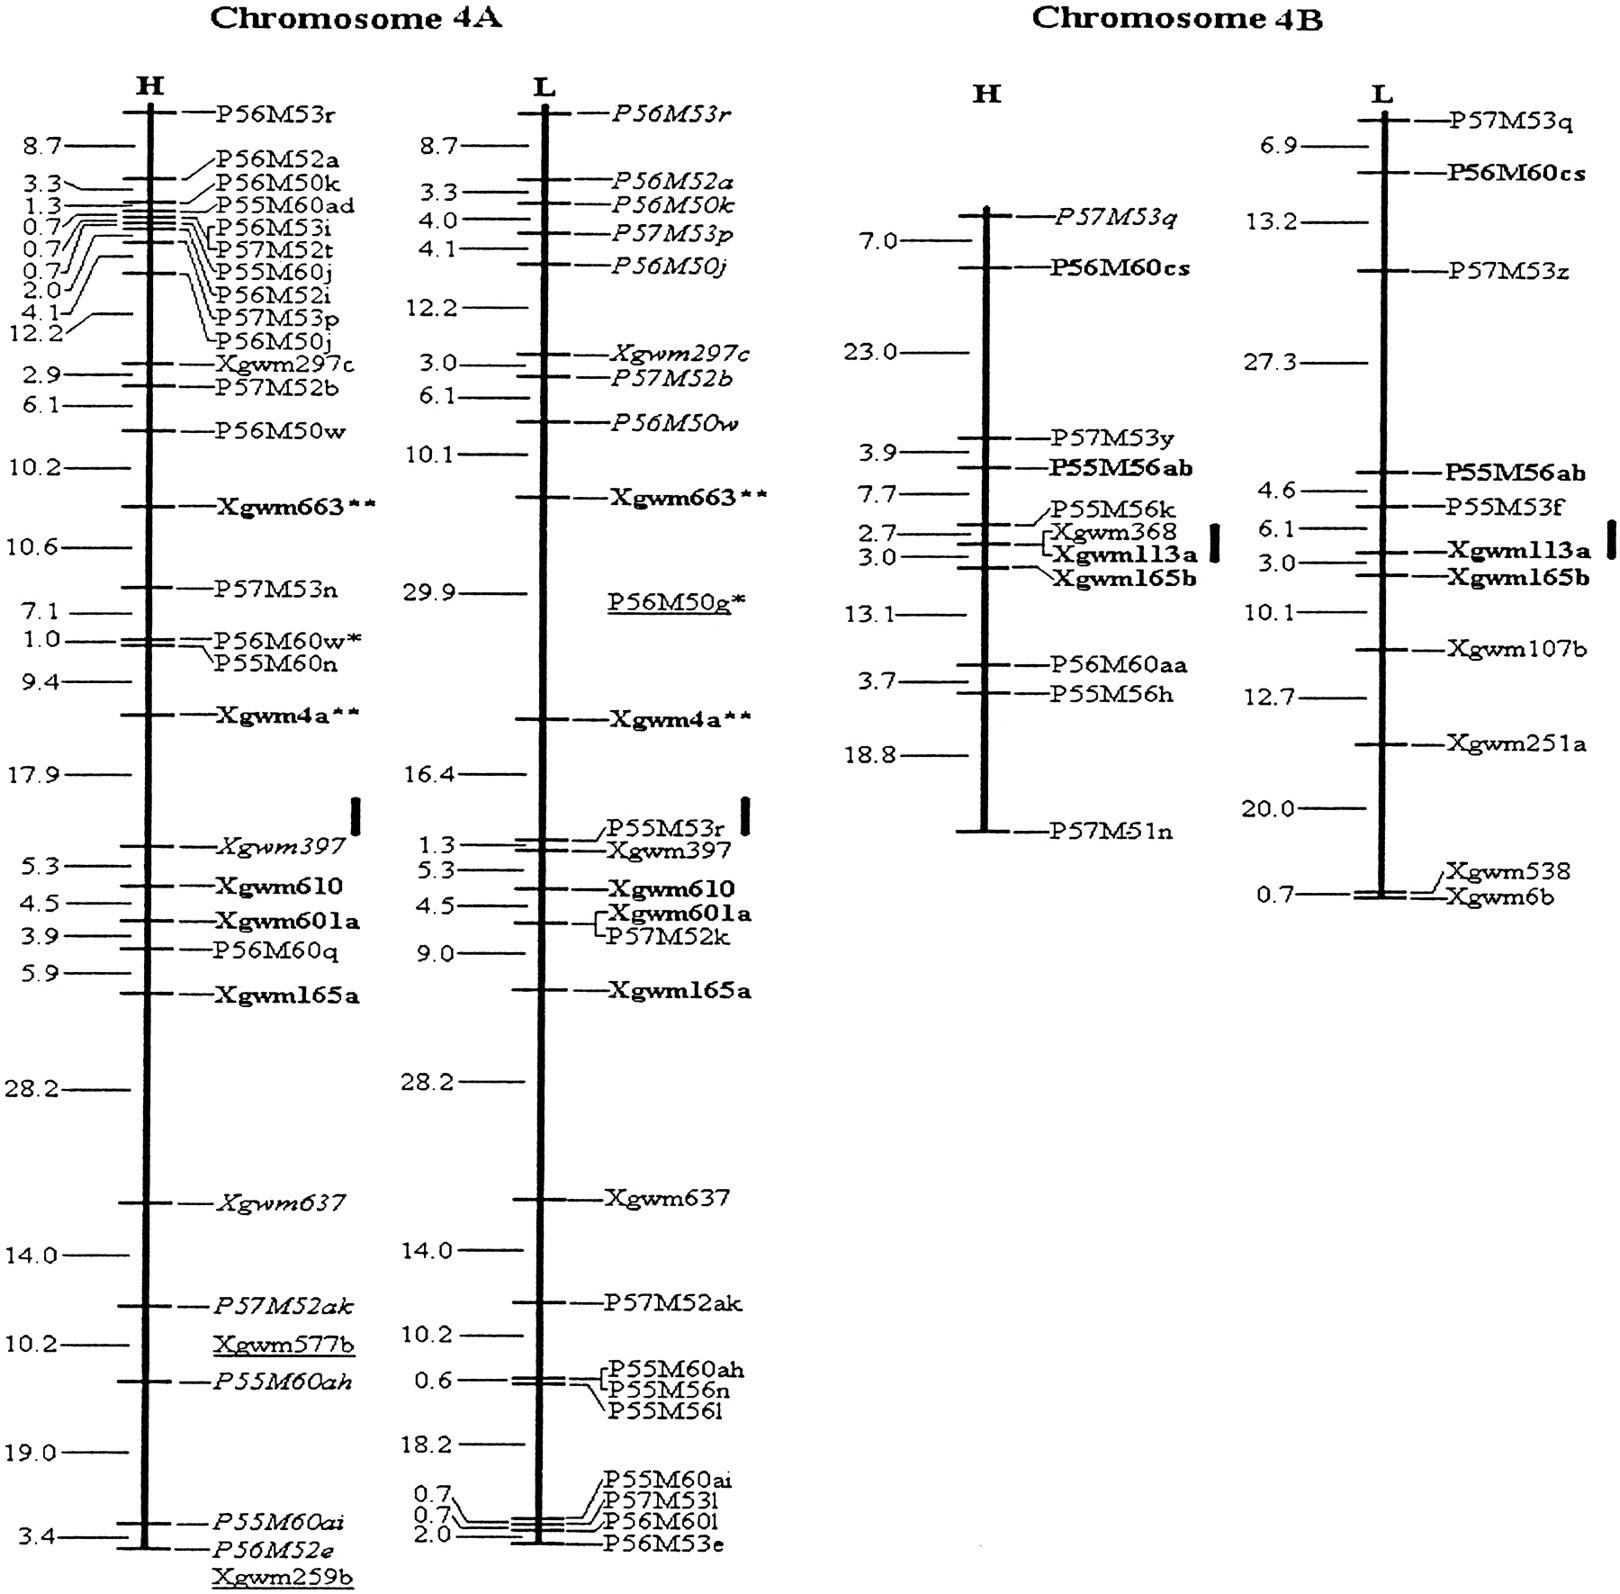
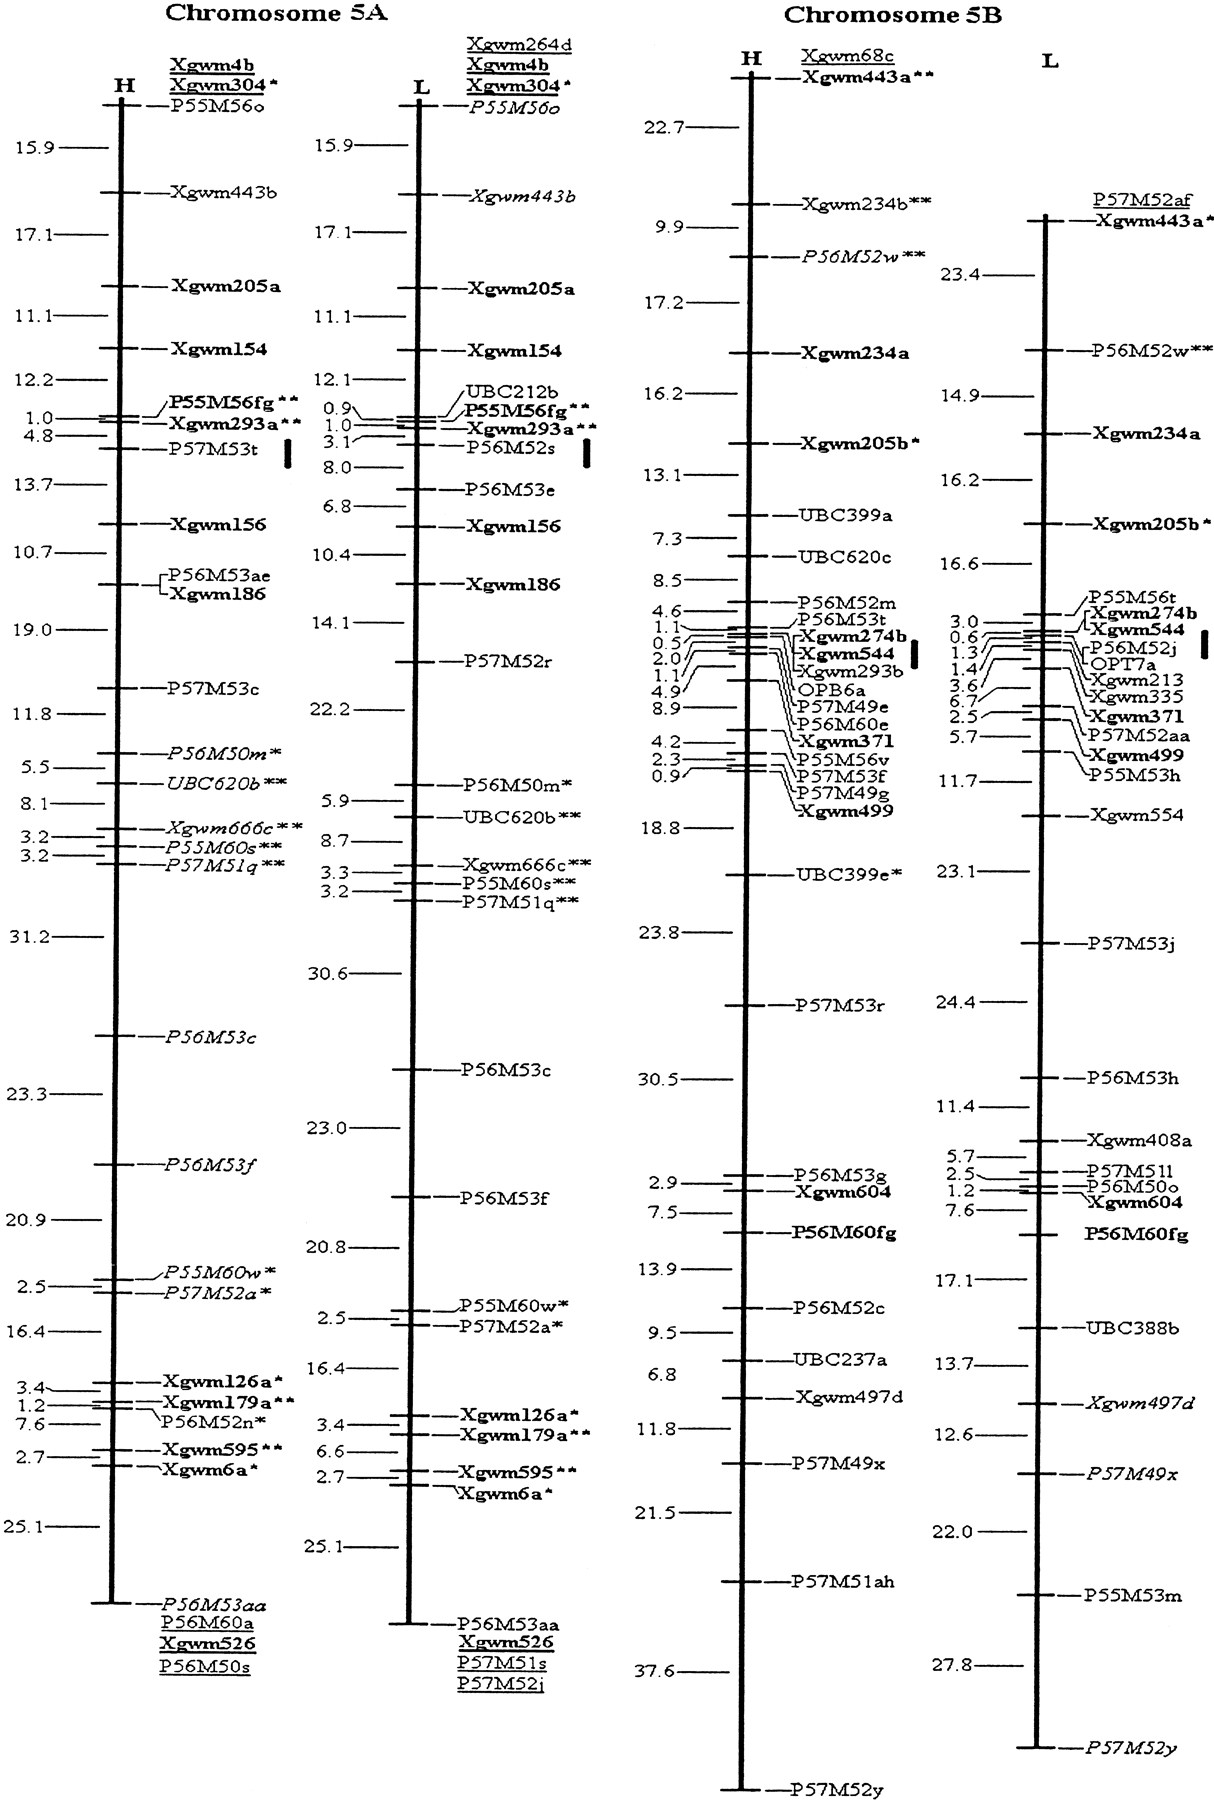
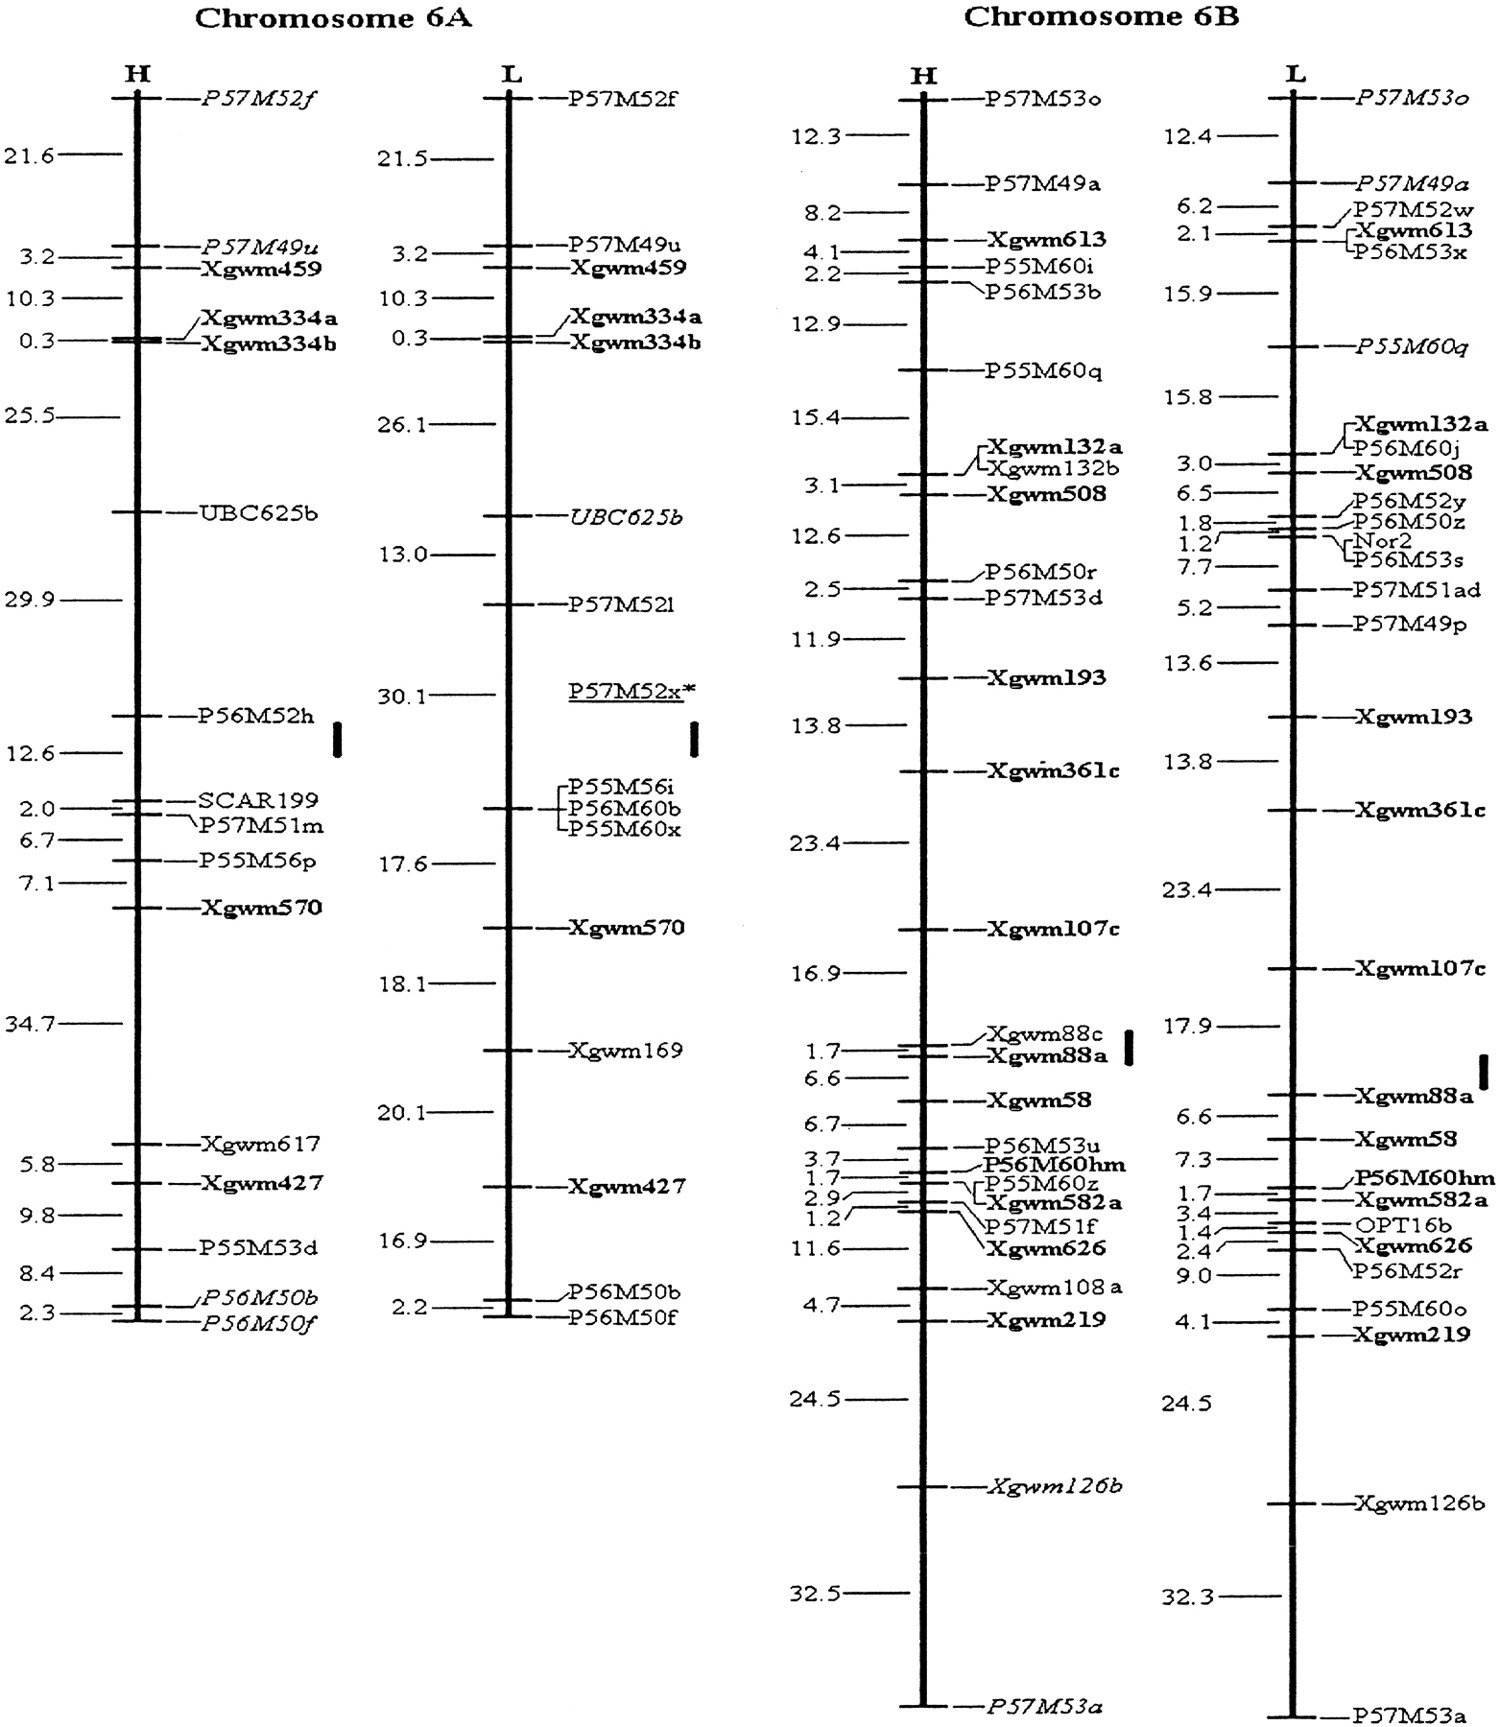
Molecular genetic maps of wild emmer wheat, Triticum dicoccoides. The centromeric location is cited from Röder et al. (1998) and is approximately indicated by the short vertical bar. Short arms of chromosomes are at the top. Genetic distances on the left of the maps are given in centi-Morgans (cM) estimated with theKosambi (1944) mapping function. The H map is essentially constructed using codominant markers and the T. dicoccoides H52 derived dominant markers. The L map is based on codominant markers and theTriticum durum Langdon-derived dominant markers. The underlined markers with relatively lower LOD scores (2.0–2.5) are placed in the most probable intervals. The markers in italics are from the opposite map and in repulsion phase. The markers in boldface are codominant.(*, **) Markers that are significantly and highly significantly deviated from the expected segregation ratio (3:1 or 1:2:1), respectively. Ws on chromosome 1B is a gene for spike glaucousness.