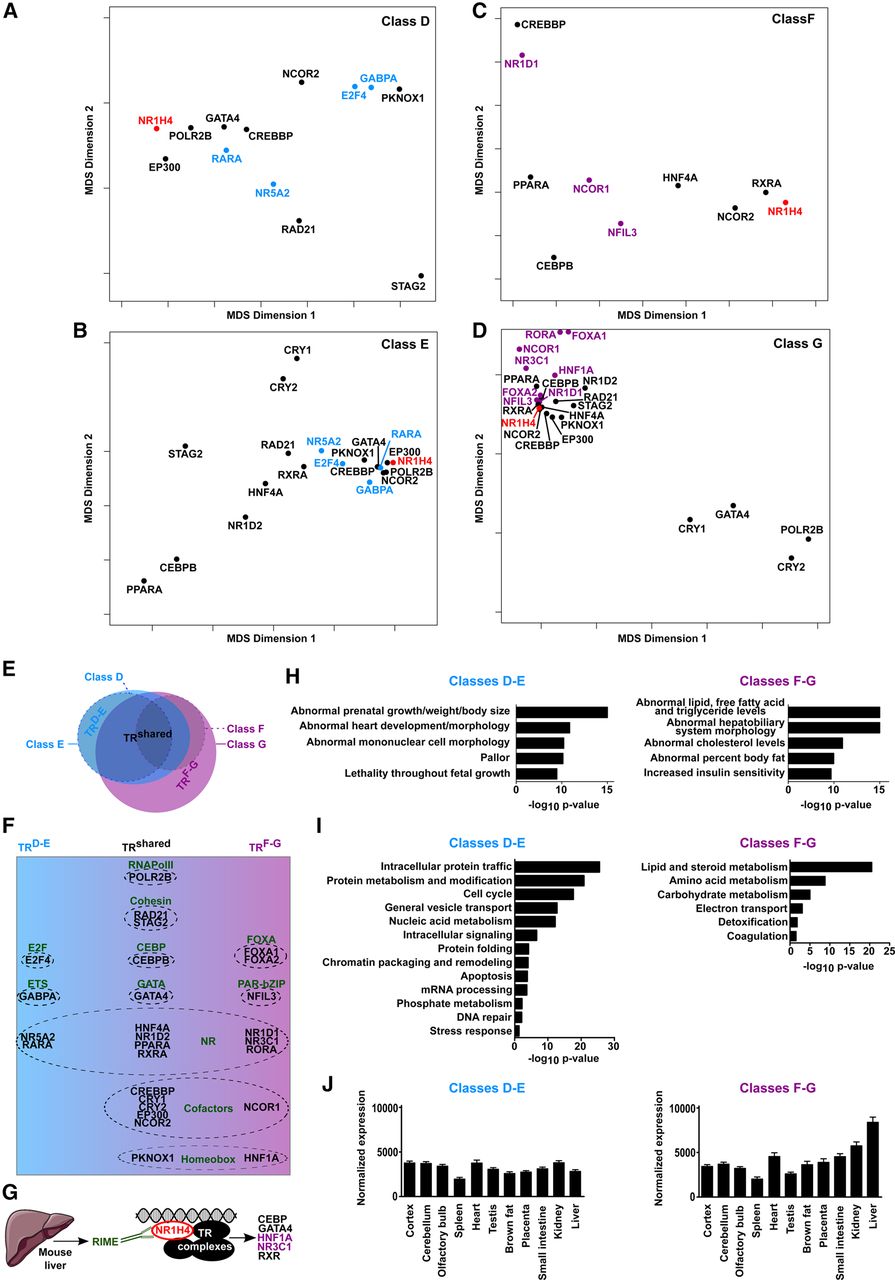
NR1H4-bound CRMs comprise two main classes which relate to the regulation of different gene sets and biological functions. (A–D) Multidimensional scaling (MDS) was performed as described in the Methods section using CRM from classes D, E, F, or G as indicated. These panels show TRs which are the most strongly interconnected with NR1H4 in each class (Tanimoto index > 0.7). NR1H4 is depicted in red while TRsD-E and TRsF-G specifically found in CRMsD-E or CRMsF-G are depicted in blue or violet, respectively. TRsshared are depicted in black and were found both in CRMsD-E and CRMsF-G. (E) Venn diagram summarizing the overlaps between TRs found at CRMs from classes D to G in panels A–D. (F) Overview of TRs comprising the TRshared, TRD-E, and TRF-G subsets. TRs were grouped according to their function or affiliation to larger families, which are indicated in bold. (G) TRs highlighted in Figure 2F, which could be identified in complexes with NR1H4 in RIME experiments, are indicated. As expected, NR1H4 was retrieved from these analyses but is not reported. (H) The main TRs found at CRMsD-E or CRMsF-G from panels A–D were used in ToppCluster to identify associated mouse phenotypes (Kaimal et al. 2010). Bonferroni-corrected P-values (−log10) are shown. (I) Gene ontology (GO) enrichment analyses were performed using DAVID (Huang et al. 2009) and genes associated with CRMsD-E or CRMsF-G. Bonferroni-corrected P-values (−log10) are shown. (J) Average normalized mRNA expression levels of genes associated with CRMsD-E or CRMsF-G across indicated mouse tissues were obtained using BioGPS data (Wu et al. 2009). Results are means ± S.E.M.