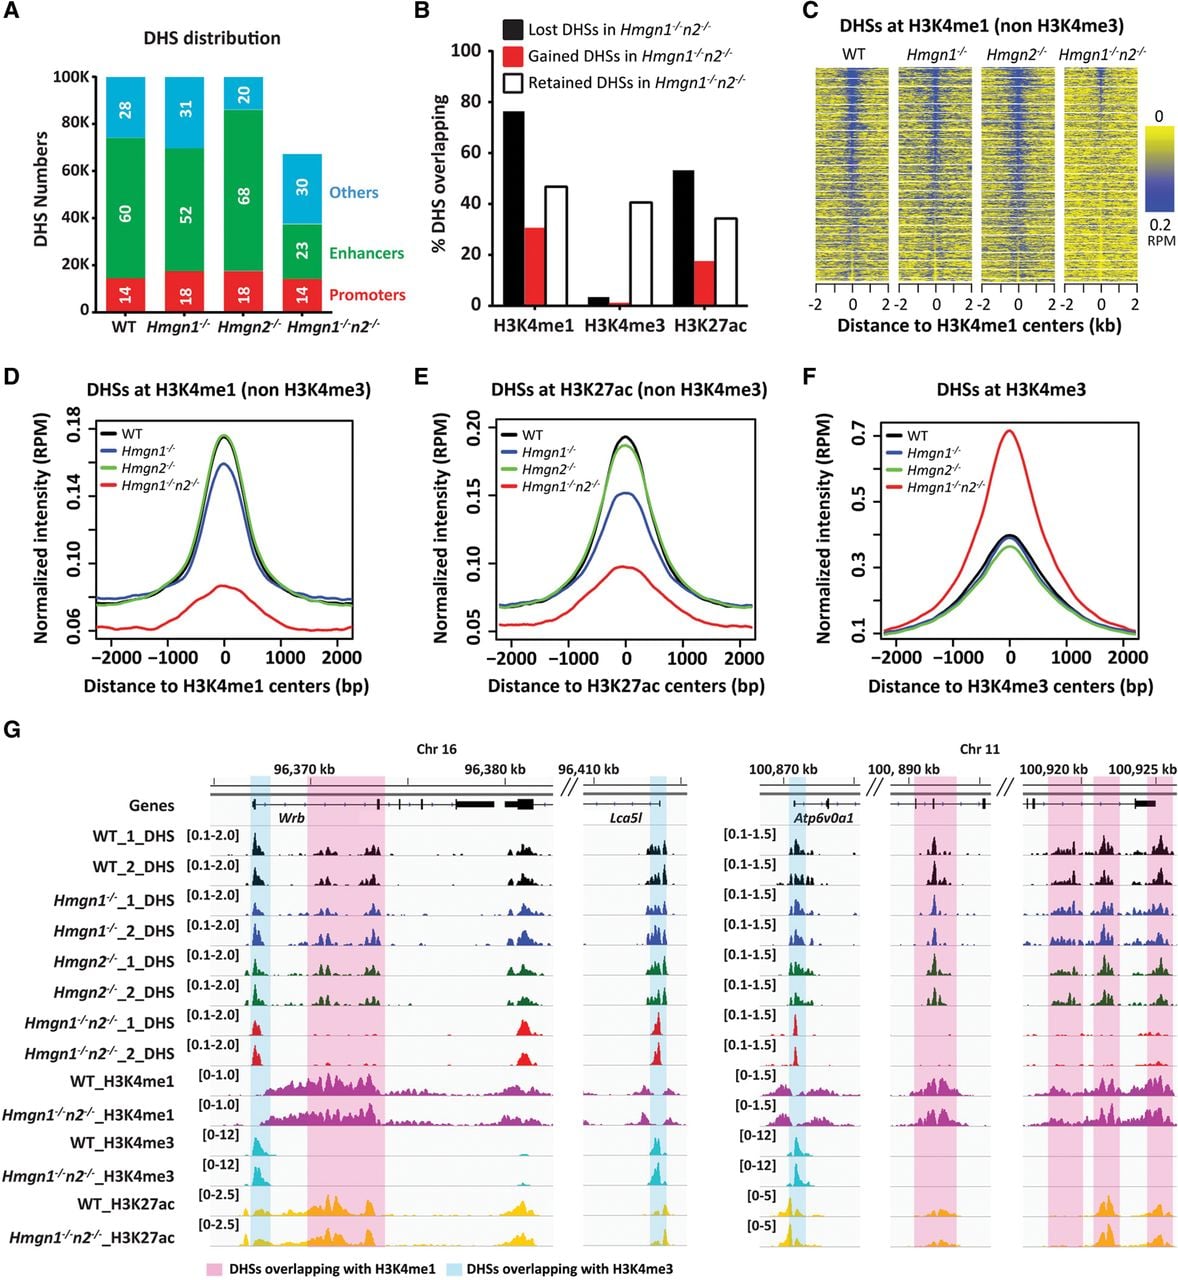
Altered DHSs at Hmgn1−/−n2−/− enhancers. (A) Loss of DHSs at enhancers of Hmgn1−/−n2−/− MEFs. Shown is the DHS distribution among annotated sequences in genome of WT, Hmgn1−/−, Hmgn2−/−, and Hmgn1−/−n2−/− MEFs. (B) Changes in DHSs at regions overlapping with enhancers (H3K4me1 or H3K27ac) but not promoters (H3K4me3). (C) Heat maps of DHS intensities across all H3K4me1, not overlapping H3K4me3, peak regions (center aligned), visualizes the loss of DHSs at H3K4me1 regions in Hmgn1−/−n2−/− MEFs. (D–F) Normalized average intensity of DHSs in WT and mutant MEFs, at indicated histone marks. (G) Genomic browser snapshot visualizing the preferential loss of DHSs overlapping H3K4me1 and H3K27ac in Hmgn1−/−n2−/− MEFs. Two biological replicates are shown for the DHS maps. Numbers in parenthesis indicate the scales of the y-axis.