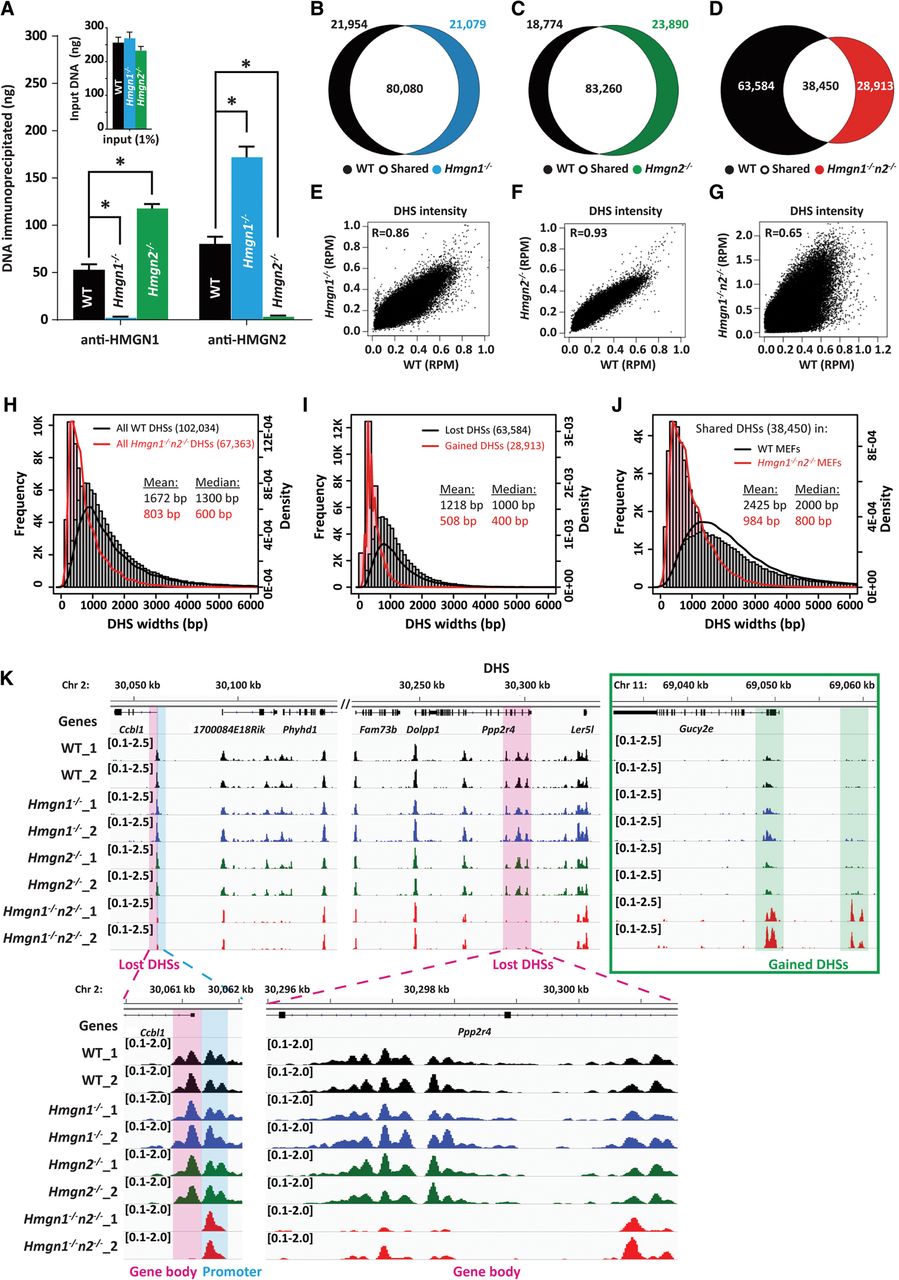
Altered DHS landscape in Hmgn1−/−n2−/− MEFs. (A) Quantitative analyses of the chromatin immunoprecipitated from either WT, Hmgn1−/−, or Hmgn2−/− MEFs with antibodies to either HMGN1 or HMGN2. Note that loss of either HMGN1 or HMGN2 variant increased the amount of chromatin precipitated by the remaining variant. (*) P < 0.001. (B–D) Venn diagrams showing the overlap in the DHSs between WT and either Hmgn1−/−, Hmgn2−/−, or Hmgn1−/−n2−/− MEFs. (E–G) Scatter plot showing similar intensity of DHSs in WT and Hmgn1−/− or Hmgn2−/−, but not in Hmgn1−/−n2−/− MEFs. DHS signals are normalized by library size and averaged over two biological replicates over each site in reads per million (RPM). (H–J) Reduced DHS width in Hmgn1−/−n2−/− MEFs. In Hmgn1−/−n2−/− MEFs, the mean width of all DHSs is narrower (H), the width of DHSs lost is larger than that of DHSs gained (I), and the shared DHSs are narrower (J) compared with WT MEFs. Bars show frequency, and curves show density. (K) Genome browser snapshot visualizes the lost or gained DHSs in Hmgn1−/−n2−/− MEFs. Two biological replicates for each genotype are shown. Numbers in parentheses indicate the scales of the y-axes.