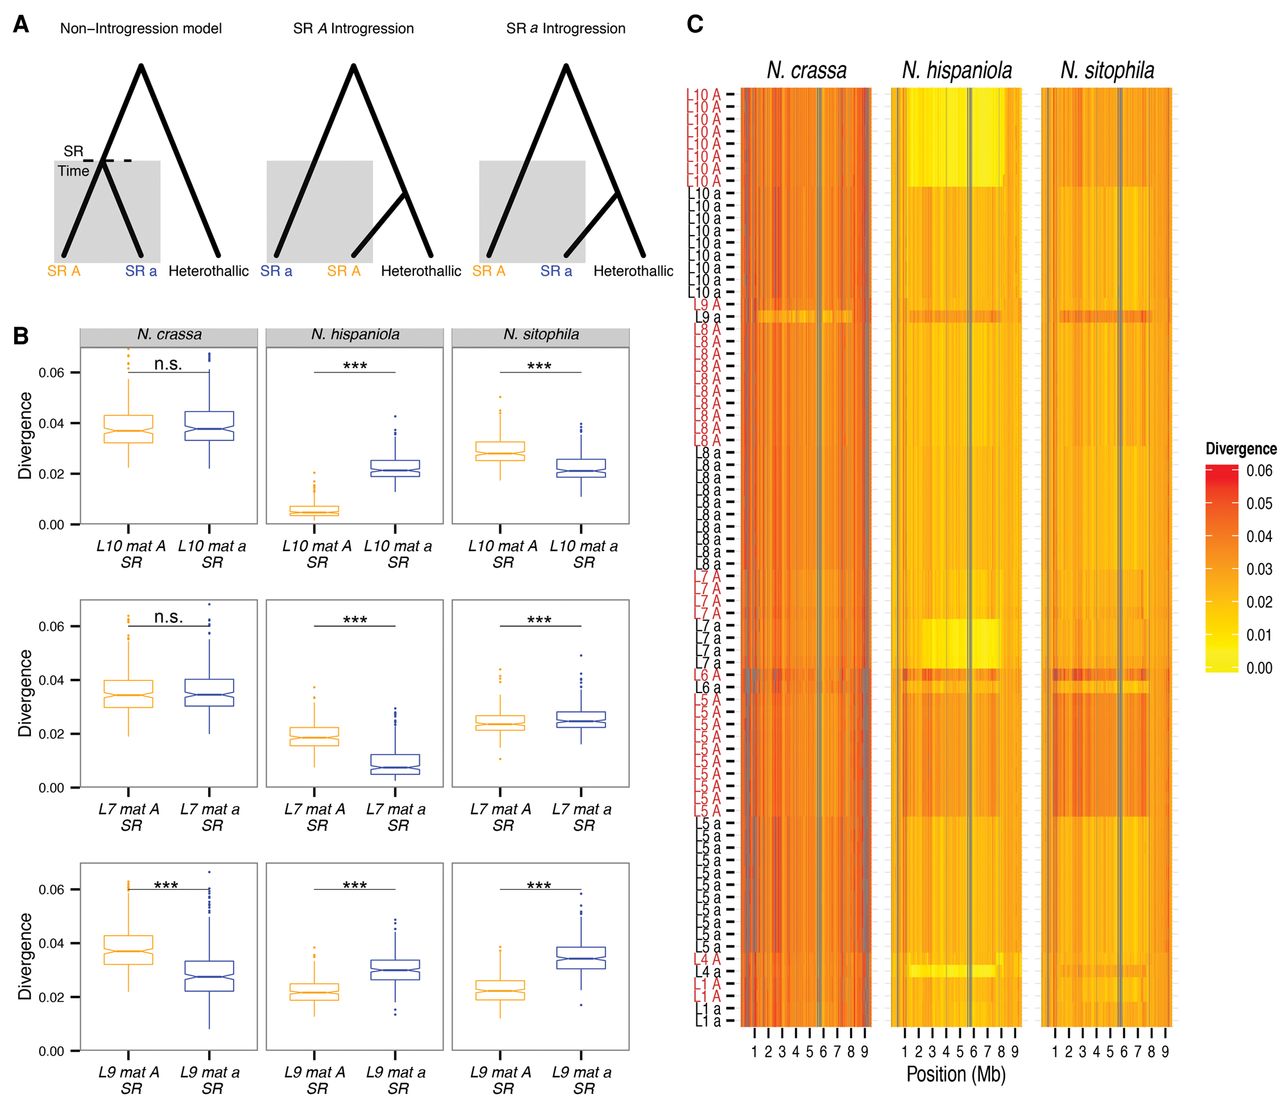
Introgression of large chromosomal regions from heterothallic Neurospora to N. tetrasperma. (A) Diagrams showing the genealogy of the mat chromosome SR region in a N. tetrasperma lineage when suppression of recombination had begun at SR Time. The shaded regions show that a lineage is in SR. The models from left to right show expected relationships in the absence of introgression, SR A introgression, and SR a introgression. (B) Box plots of mean divergence between L10, L7, and L9 in the SR region. Asterisks above the horizontal black lines are the P-values for the Mann-Whitney U test between SR regions within a lineage: (***) P < 0.001; (n.s.) nonsignificant. (C) Pair-wise divergences between the mat chromosomes of N. tetrasperma strains and the heterothallic species N. crassa, N. hispaniola, and N. sitophila. Each row in the figure shows the sequence divergence between a strain of N. tetrasperma and the heterothallic species indicated in the heading of the column, using a nonoverlapping sliding window of 25 kb. N. tetrasperma strains are sorted by lineage and according to mating type. Regions lacking a sufficient number of sites (2500 sites) are colored gray. A maximum divergence of up to 0.06 is plotted, and windows exceeding this are colored gray.