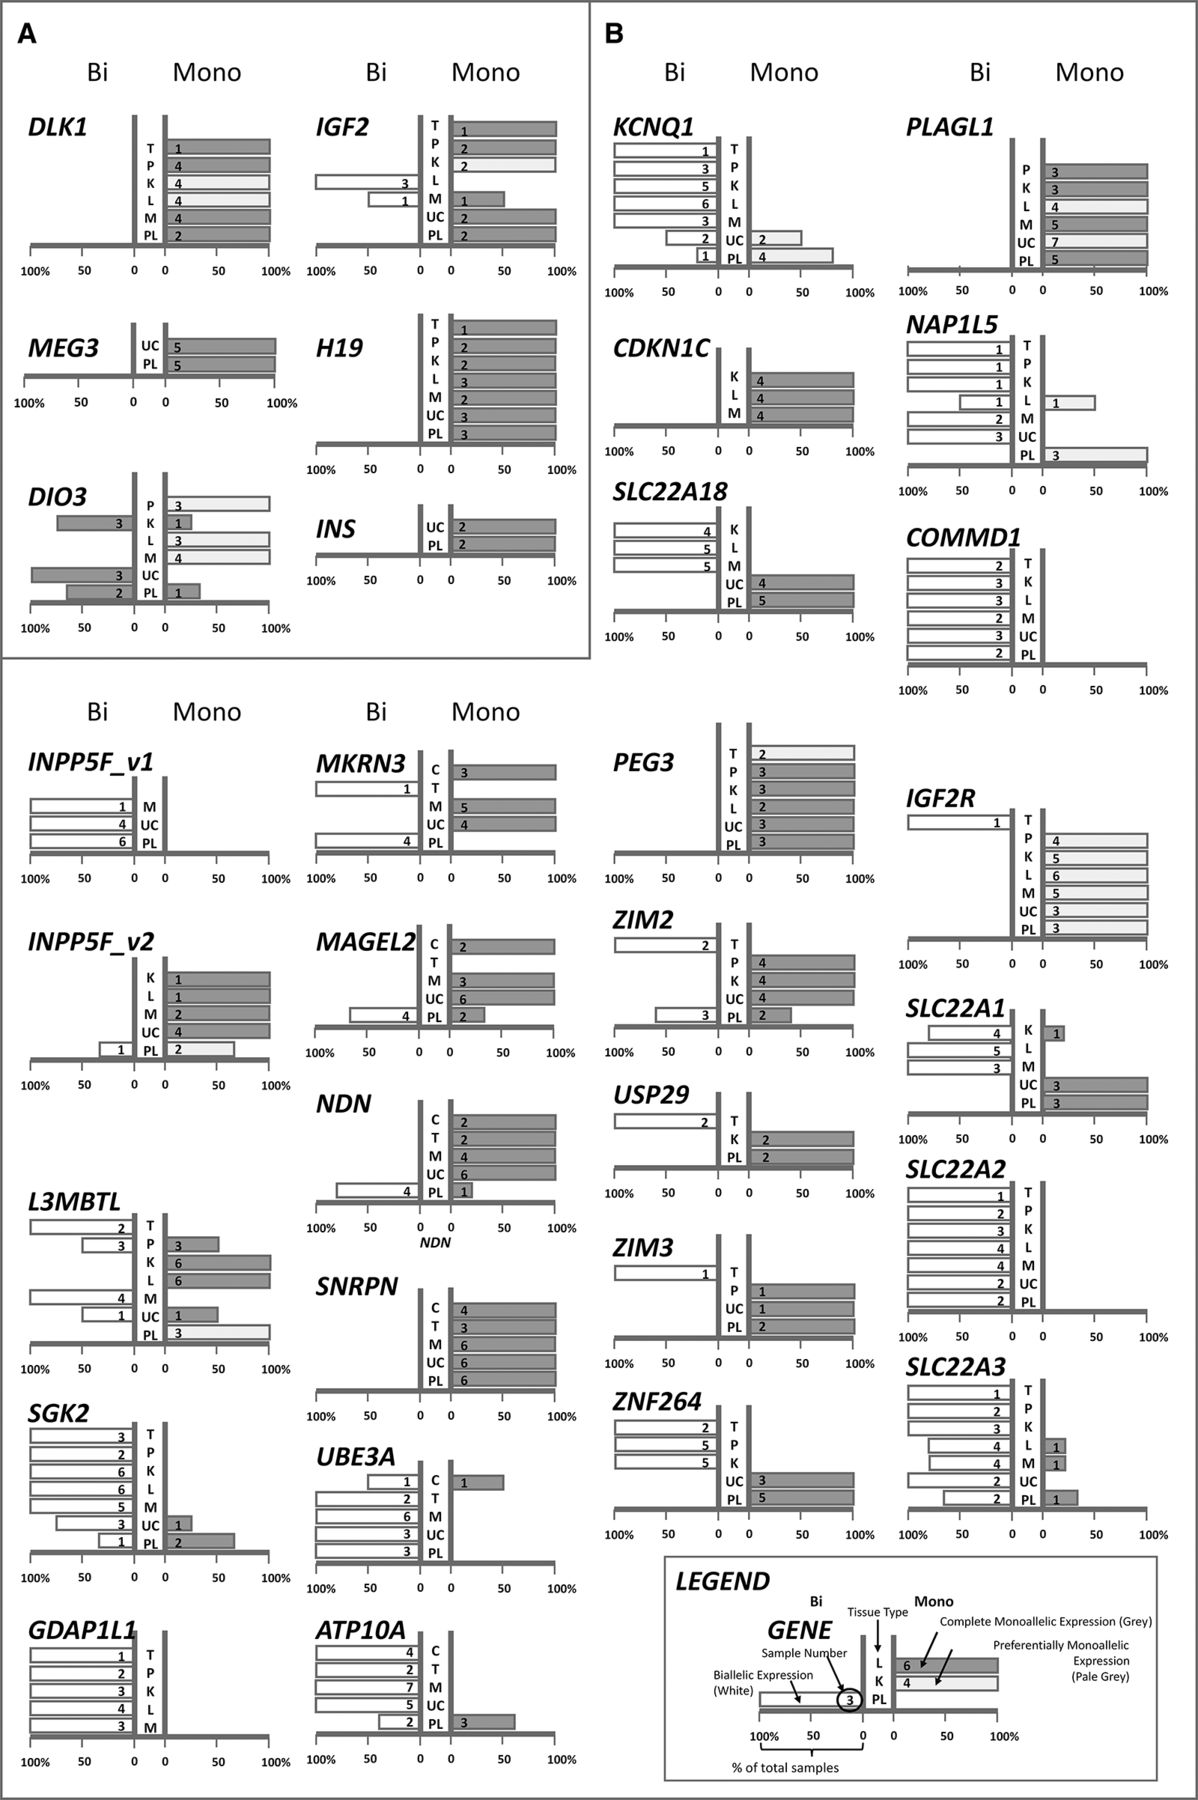
Imprinted expression profile in tissues. Individual charts show allelic expression for each gene across the main tissue types examined. (A) Paternally imprinted gene clusters. (B) Maternally imprinted gene clusters. The length of each bar represents the percentage of total samples adhering to either expression pattern—biallelic (left) or monoallelic (right). A further distinction is made between complete and preferential monoallelic expression at each gene: complete monoallelic expression (gray) and preferential monoallelic expression (pale gray). See Supplemental Figure 2 for quantitative pyrosequencing and capillary sequencing data. The number of samples analyzed is shown in each bar, and tissue type is listed in the central column of each chart. (C) Cerebellum, (T) Testes, (P) pancreas, (K) kidney, (L) liver, (M) muscle, (UC) umbilical cord, (PL) placenta. These data are also tabulated in Supplemental Table 1, with additional data available for select genes/tissues.