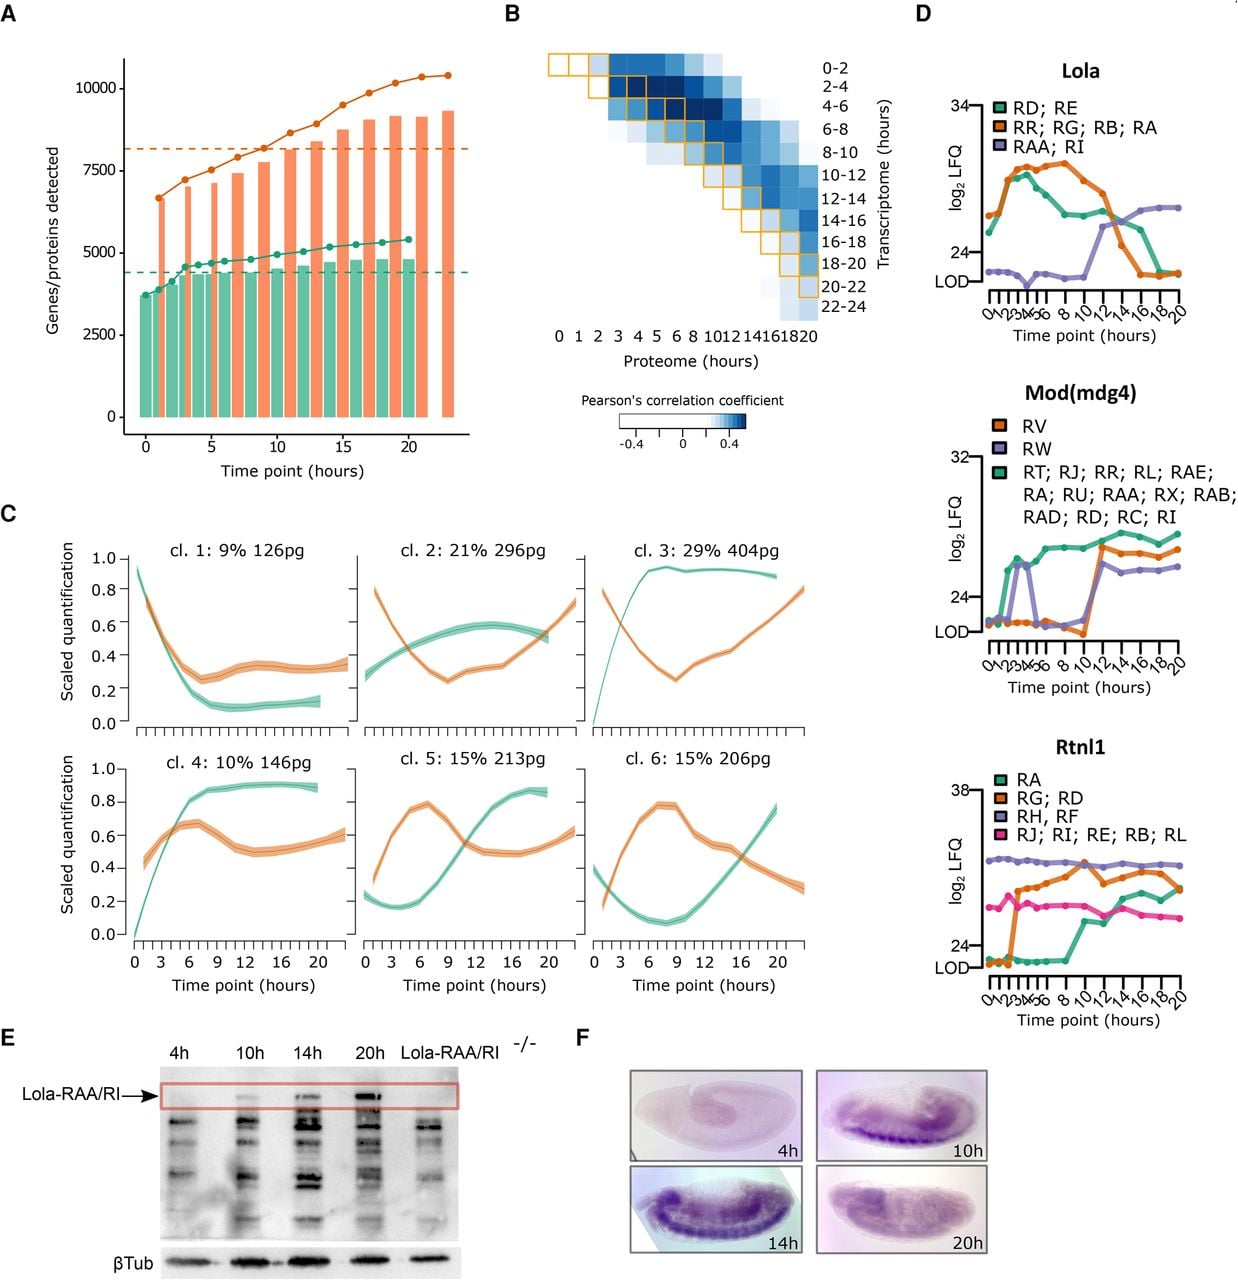
Temporal transcriptome/proteome dynamics and isoform quantitation. (A) Plot showing the number (bars) of detected transcripts (orange) and proteins (green) at each time point. The solid line depicts the cumulative sum of unique transcripts (orange) and proteins (green). The dashed line represents the median across all time points. (B) Heat map displaying the Pearson correlation between transcript and protein expression levels. Matching time points between the two data sets are indicated by orange boxes. (C) Median scaled quantification plotted after clustering of the first PCA component of RNA (orange) and protein (green) expression into six different categories. Shaded regions display the standard error of the fitted line. (D) Expression profiles with isoform-specific information of three proteins: Lola, Mod(mdg4), and Rtnl1. Isoforms are colored according to the legend. (E) Validation of Lola-RAA/Lola-RI isoform quantitation by immunoblotting against Lola at four selected time points. Protein lysate of lola-RAA/lola-RI mutant embryos at 20 h were used to identify the isoform-specific band (arrow) corresponding to Lola-RAA/Lola-RI. Beta-tubulin was used as a loading control. (F) RNA levels were determined by in situ hybridization at the selected time points with a specific probe for lola-RAA/lola-RI.