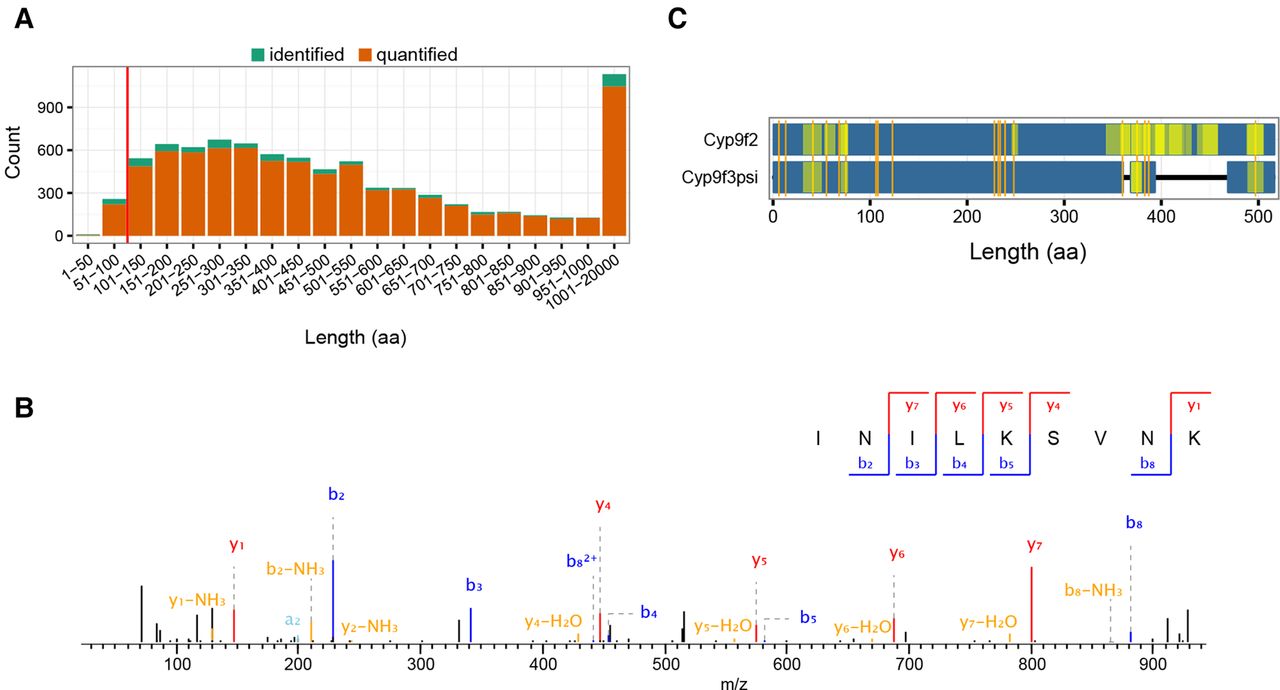
Small proteins and peptides from noncoding regions of the genome. (A) Protein length distribution of identified (green, not enough quantitation values) and quantified (orange) protein groups of the life cycle proteome. Most proteins have quantitation values (>90%), and this fraction only marginally depends on protein length. The red line demarcates the fraction of 268 small proteins (<100 aa). (B) Representative MS/MS spectrum with annotated b- and y-ions of the peptide INILKSVNK(2+) from the putative noncoding gene CR43476. (C) Sequence comparison of Cyp9f2 and the “pseudogene” product Cyp9f3Ψ with amino acid substitution between both proteins marked in orange. Coverage of peptides for either protein is shown (yellow, more intense regions have overlapping peptides).