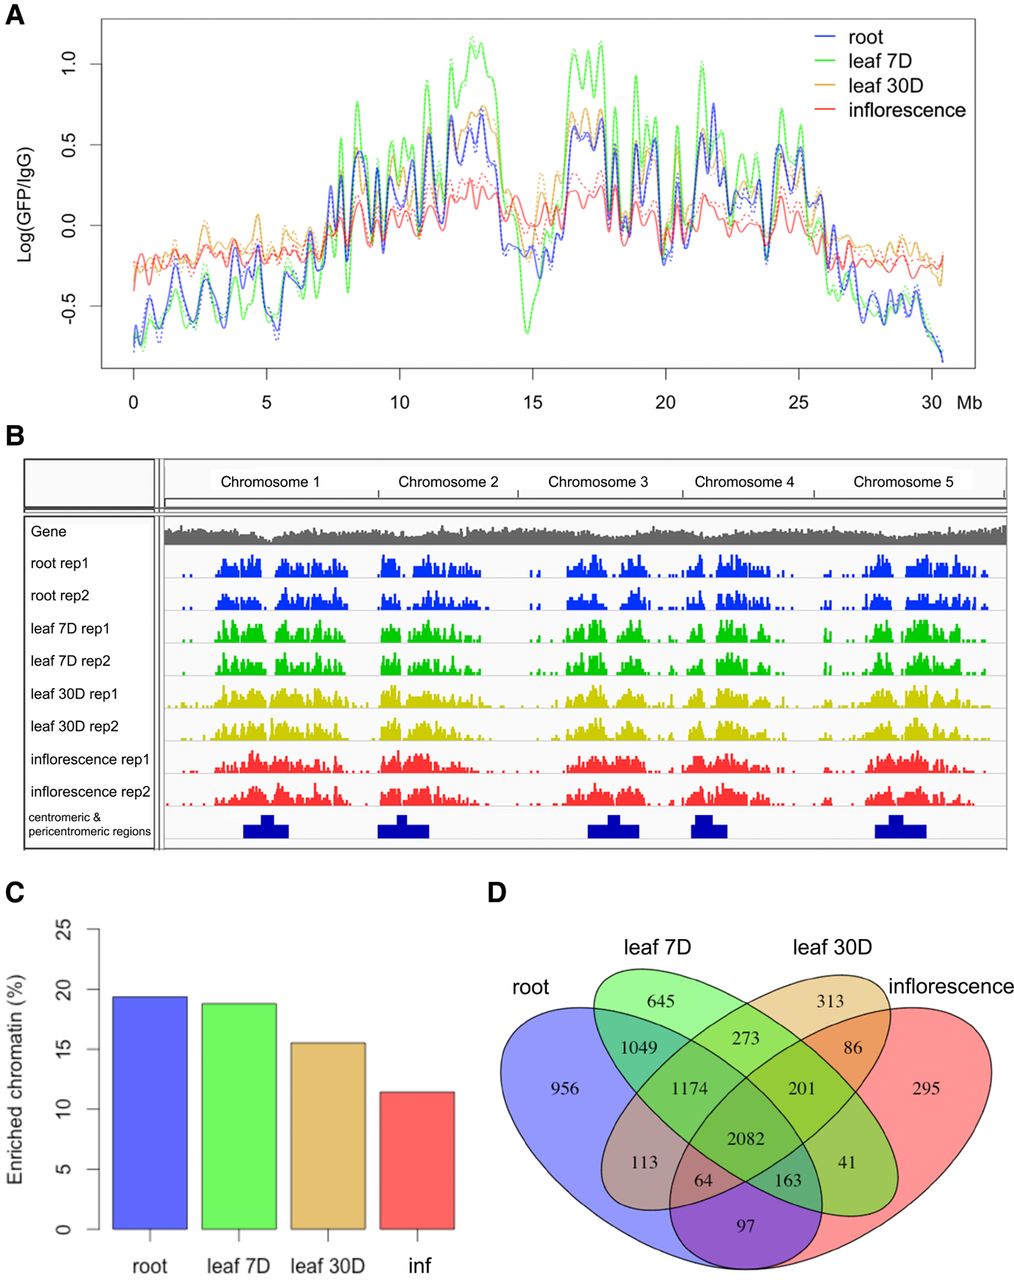
Figure 3.
Genome-wide identification of NUP1-enriched regions in various tissues. (A) Signals of NUP1:GFP RE-ChIP-seq (20-kb window size), represented as the log2 value of the ratio between normalized anti-GFP and IgG sequence coverage over Chromosome 1. For each tissue, the solid and dotted lines depict two replicates. (B) Distribution of NUP1-enriched domains across the genome viewed with the Integrative Genomics Viewer browser (Robinson et al. 2011). (C) Percentage of NUP1-enriched genomic regions: (inf) inflorescence. (D) Venn diagram of genes enriched in four tissues.