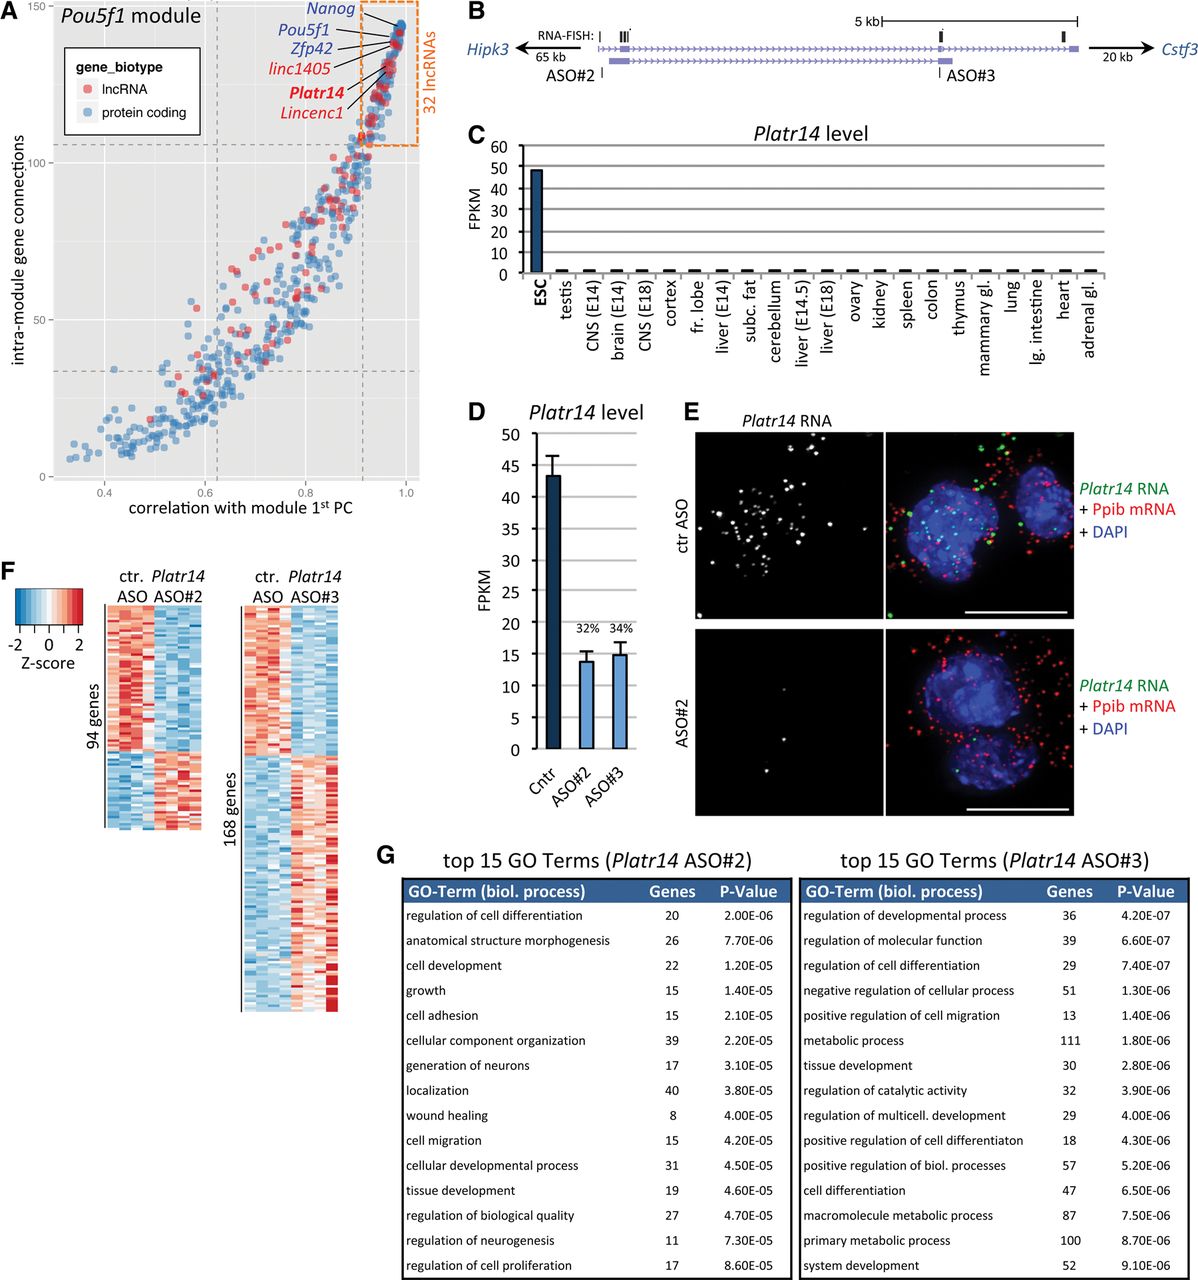
Platr14 lncRNA is functionally integrated in ESC gene expression regulation. (A) Connectivity between genes within the Pou5f1 module (see Fig. 3B) is plotted against the module's first principal component (module gene expression). Dotted lines correspond to first and third quartiles. (Red) lncRNA genes; (blue) mRNA genes. (B) Schematic of annotated Platr14 isoforms. Targeting sites of ASO#2 and ASO#3 are indicated. Black lines above the transcript model represent targeting sites of RNA FISH probes. For greater detail and cloned Platr14 cDNA, see Supplemental Figure S7. (C) Expression of Platr14 in AB2.2 ESCs and ENCODE tissues. (D) Expression level of Platr14 in ESCs 24 h after transfection with control ASO (Cntr) or two independent ASOs specific against Platr14 lncRNA. Data represent the mean and standard deviation of four biological replicates. (E) Single-molecule RNA FISH for Platr14 lncRNA (green) and Ppib housekeeping mRNA (red) in AB2.2 ESCs transfected with control ASO or Platr14 specific ASO. (Scale bar) 10 µm. (F) Heatmap (gene-wise Z-score) of genes significantly affected within 24 h of transfection of Platr14 specific ASOs (FDR < 0.05). (G) Top 15 nonredundant GO terms enriched in the set of differentially expressed genes for each ASO. Enrichment was ranked based on Fisher's exact test.