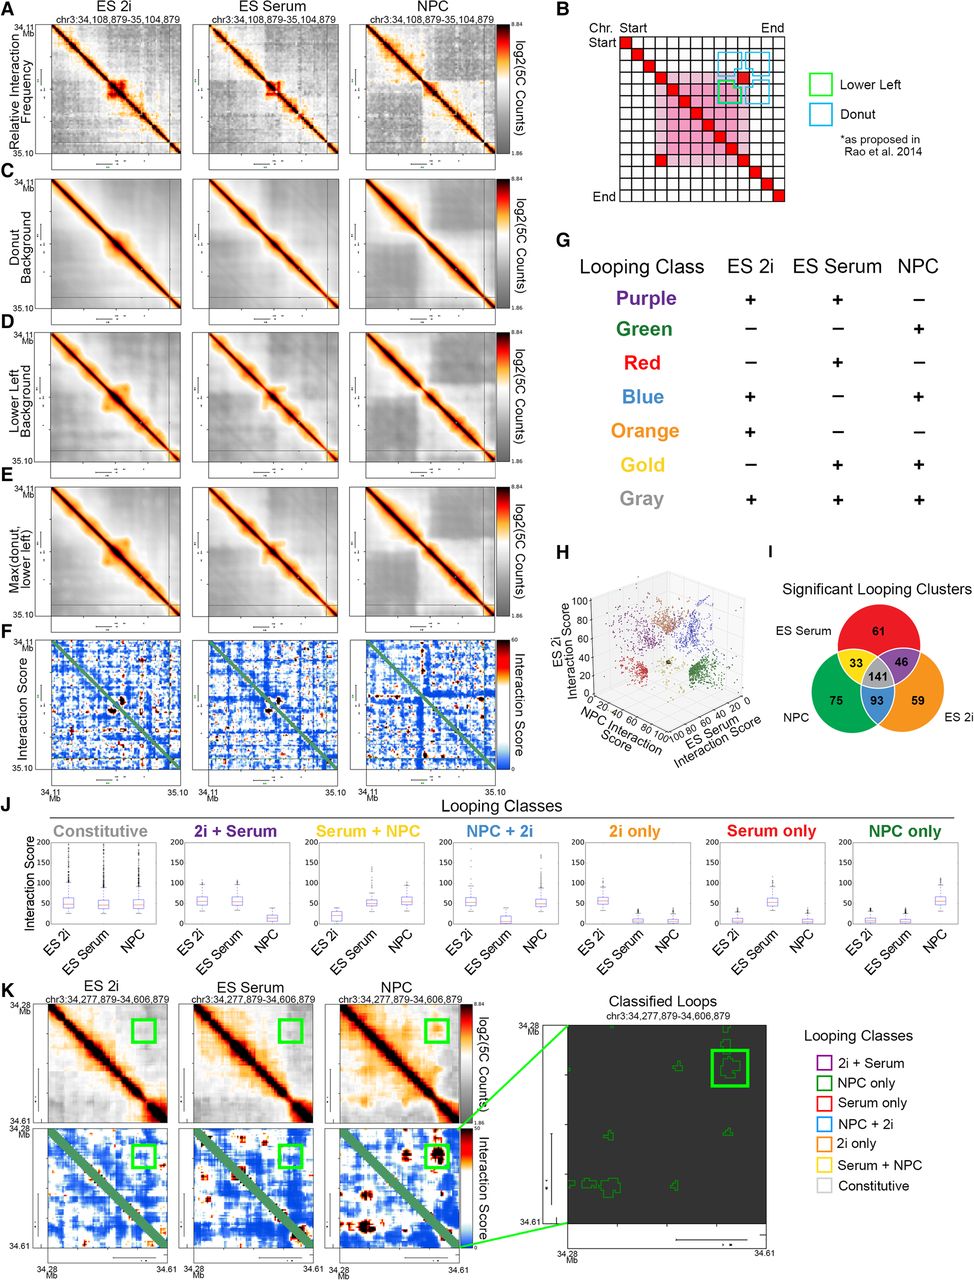
Dynamic classes of 3D interactions arise during neural lineage commitment. (A) Heatmaps displaying the relative chromatin contact frequency in a 1-Mb region surrounding the Sox2 gene in ES 2i, ES serum, and NPCs. Color bars range from low (gray) to high (red/black). (B) Schematic depiction of donut (blue) and lower left (green) expected background models. (C–E) Expected background heatmaps for the region surrounding the Sox2 gene. (C) Donut filter, (D) lower left filter, and (E) maximum value of donut and lower left filters. (F) Interaction score heatmaps at the Sox2 locus. Color bar ranges from low (blue) to high (red/black). (G) Schematic of looping classes parsed by their dynamic behavior across three cellular states. (H) Scatter plot of 5C interaction scores for each pixel classified as part of a looping interaction across the ES 2i, ES serum, and NPC states (Supplemental Methods). (I) Number of significant looping clusters in each dynamic 3D interaction class. (J) Box plots representing interaction scores across each cell type for the pixels classified into each looping class. (K) Visualization of a Sox2-pluripotency enhancer interaction in relative interaction frequency heatmaps (top left), interaction score heatmaps (bottom left), and classified loop clusters (right).