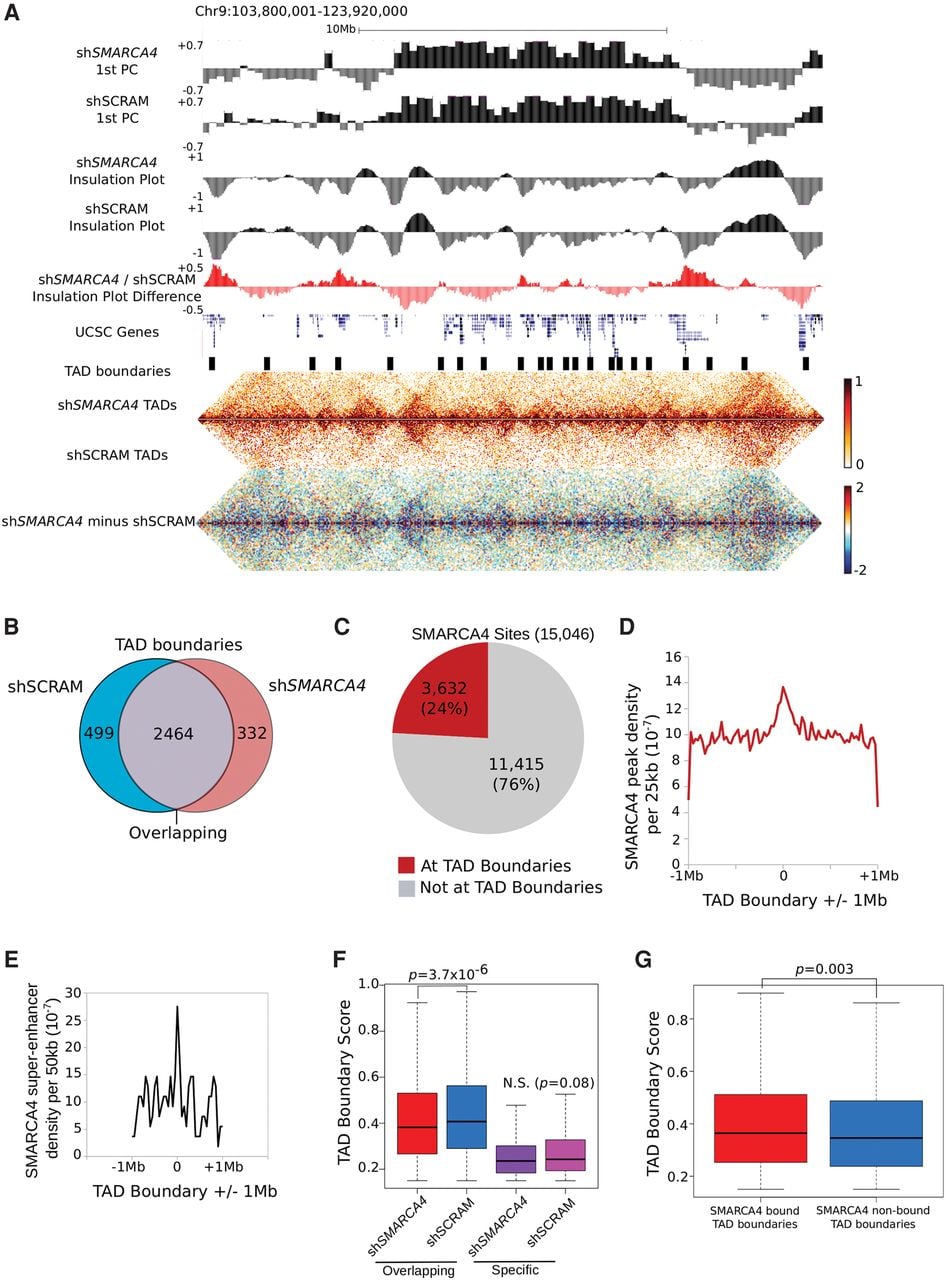
(A) An example of a region on Chr 9 (Chr 9: 103800001–123920000) showing (from top to bottom) the compartment profiles of shSMARCA4 and shSCRAM at 250-kb intervals, the insulation plot profiles at 40-kb intervals (see Methods), the insulation plot difference between shSMARCA4 and shSCRAM, hg19 UCSC genes, TAD boundaries, shSMARCA4 and shSCRAM contact heatmaps showing the TADs, and a subtraction of the shSCRAM from the shSMARCA4 contact heatmap. (B) Venn diagram showing that the TAD boundaries are largely similar between shSCRAM and shSMARCA4 Hi-C data sets. (C) Pie chart showing the percentage of SMARCA4 localization at TAD boundaries. (D) The frequency plot of SMARCA4 ChIP-seq peaks per 25 kb for ±1 Mb of every shSMARCA4 TAD boundary. (E) The frequency plot of SMARCA4 super-enhancers per 50 kb for ±1 Mb of every shSMARCA4 TAD boundary. (F) Box plot showing the TAD boundary score distribution for the overlapping and the shSCRAM- and shSMARCA4-specific TAD boundaries. P-value: Wilcoxon rank-sum test. (G) SMARCA4 binding is associated with higher (Wilcoxon rank-sum test; P = 0.003) TAD boundary score. Box plot showing the TAD boundary scores for SMARCA4-bound and unbound TAD boundaries.