Abstract
Estrogen receptor 1 (ESR1; also known as ERα, encoded by ESR1 gene) is the driving transcription factor in breast cancer development and progression. ESR1 genomic action is thought to operate under tight epigenetic control, with its chromatin binding and subsequent transcriptional output heavily reliant on the pioneer transcription factor FOXA1, which renders chromatin accessible for ESR1 binding. However, the exact contribution of the epigenome to selective enhancer activation by ESR1 remains to be fully elucidated. To address this, we employ a massively parallel reporter assay to profile 7576 individual ESR1 binding sites for hormone responsiveness. Only a minority of ESR1-occupied enhancers exhibit hormone-induced activity. These findings are confirmed by genomic data in situ, indicating that enhancer activation within a chromatinized context is robustly captured in a plasmid-based reporter assay. In silico integration of our findings with publicly available functional genomics data sets from breast cancer cell lines and tumor samples reveal distinct transcription complex compositions, 3D genome contexts, and regulatory dynamics associated with different classes of ESR1 binding sites. Overall, our results establish a comprehensive framework to highlight and elucidate the molecular basis underlying ESR1 genomic heterogeneity and its contribution to breast cancer biology and clinical outcomes.
Estrogen receptor 1 (ESR1; also known as ERα, encoded by the ESR1 gene) is the key transcription factor in breast cancer, driving cell proliferation and tumor progression by regulating oncogenic gene expression. Upon estradiol (E2) binding, ESR1 translocates to the nucleus to occupy estrogen receptor binding sites (ERBS), which are characterized by a palindromic consensus motif (AGGTCAnnnTGACCT) (Klinge 2001). These ERBS are predominantly located at enhancers in distal intergenic and intronic regions, where their accessibility depends critically on the pioneer factor FOXA1 (Carroll et al. 2005). Once bound to DNA, ESR1 recruits a large spectrum of coactivators and corepressors in a highly coordinated fashion to regulate transcription (Yi et al. 2015). Because most ERBS are located far from gene promoters, their regulatory effects are mediated by chromatin looping (Fullwood et al. 2009).
Although ESR1 occupies several thousand genomic sites, the number of genes actively regulated in response to E2 is substantially lower (Chen et al. 2021; Piryaei et al. 2022, 2023). One proposed explanation is that the DNA-receptor-ligand complex exhibits allosteric properties (Hall et al. 2002; Meijsing et al. 2009), meaning that the primary DNA sequence not only influences binding affinity but also coregulator recruitment and genomic interactions. Yet, which ERBS are functionally active—and what distinguishes active from inactive ones—remains poorly understood, underscoring the need for a comprehensive functional characterization.
Traditional approaches to identify active enhancers often correlate transcription factor binding with chromatin accessibility, RNA polymerase II (RNAPII) recruitment, or enhancer-associated histone modifications (Andersson and Sandelin 2020). Although informative, they are not quantitative, incapable of determining direct enhancer activity, and cannot uncouple epigenomic from genomic mechanisms. On the other hand, reporter assays overcome some of these limitations by measuring enhancer activity on nonchromatinized DNA templates, isolating the contribution of DNA sequence alone (Mladenova et al. 2009). However, conventional reporter assays require each regulatory sequence to be tested individually, which complicates generalizability, as the number of candidates that can be tested is limited. Recent advances in functional genomics have addressed these limitations with the development of massively parallel reporter assays, such as Self-Transcribing Active Regulatory Regions sequencing (STARR-seq) (Arnold et al. 2013). STARR-seq measures the self-transcription of cloned genomic fragments placed downstream of a minimal promoter, allowing thousands of candidate enhancers to be tested simultaneously and independently of chromatin context.
In this study, we used STARR-seq to functionally dissect thousands of ESR1-bound enhancers to investigate the molecular determinants of their activity, aiming to clarify the heterogeneity of ERBS enhancer function and its relevance in breast cancer biology.
Results
Characterization of ERBS and their functional diversity using STARR-seq
To experimentally characterize ESR1 cis-regulatory elements and identify features regulating their activity, we reanalyzed a STARR-seq data set, previously generated in our lab (Joosten et al. 2024) (original data available from the European Genome-phenome Archive (EGA; https://ega-archive.org) under accession number EGAD50000000015). STARR-seq assesses regulatory sequence activity by cloning them downstream of a minimal promoter; active enhancers self-transcribe, resulting in higher mRNA levels detectable by RNA-seq (Arnold et al. 2013). Our STARR-seq library is based on a custom oligonucleotide probe pool of 14,299 regions comprising: (1) ESR1 peaks selected from ∼74,000 sites identified in breast cancer samples, spanning a range of conservation across patients (Joosten et al. 2024); and (2) ESR1-bound regions in the T-47D breast cancer cell line (Fig. 1A; Gertz et al. 2013). Insert sizes were normally distributed around 500 bp (Supplemental Fig. S1A), consistent with optimal sizes observed with previous similar experiments (Vockley et al. 2016; Huang et al. 2021).
STARR-seq defines functional ERBS subgroups. (A) Schematic of ESR1 STARR-seq. A total of 14,299 ESR1-bound sites identified from human breast tumors and cell lines were cloned into hSTARR-ORI plasmid, transfected into MCF-7, treated with DMSO or E2 for 6 h, and analyzed by RNA-seq to measure enhancer-driven self-transcription. (B) Post-filtering heat maps showing STARR-seq signal (purple, log2 fold change over input plasmid library) and ESR1 ChIP-seq in full-medium (red, GSE32222) (Ross-Innes et al. 2012) and after 10 min E2 stimulation (blue, GSE54855) (Guertin et al. 2014). ChIP-seq signals are represented as reads per genomic content (RPGC). Regions are grouped by STARR-seq-defined functional classes. (C) Volcano plot of STARR-seq signal log2(fold change, E2 vs. DMSO). Dashed lines represent significance thresholds (|log2(fold change)| > 1 and Padj < 0.05). (D) Bar plot of ERBS distribution and counts (in white). Green, blue, and yellow bars represent induced, constitutive, and inactive ERBS, respectively. (E) Snapshot of the XBP1 locus, showing STARR-seq data (RNA over DNA fold change), and ChIP-seq for ESR1 in full-medium (GSE32222) (Ross-Innes et al. 2012), ESR1 with and without 10 min E2 stimulation (GSE54855) (Guertin et al. 2014), FOXA1 with and without 45 min E2 stimulation (GSE23852), and RNAPII with and without 10 min E2 stimulation (GSE62789) (Honkela et al. 2015). Green, blue and yellow boxes represent induced, constitutive, and inactive ERBS, respectively. Numbers represent signal intensity. (F) ESR1 ChIP-seq signal across ERBS subtypes during E2 time course (GSE54855) (Guertin et al. 2014). Significance of Tukey's honest significant difference test following a one-way ANOVA is indicated. (G) Percentage of ERBS with consensus ESR1 motifs. (H) RNAPII ChIP-seq signal across ERBS subtypes during E2 time course (GSE62789) (Honkela et al. 2015). Significance of Tukey's honest significant difference test following a one-way ANOVA is indicated. (I) Gene expression fold changes for genes linked to each ERBS subgroup after 24 h E2 treatment in MCF-7 (GSE99680) (Chi et al. 2019). Significance of Wilcoxon test is indicated. (J) Hypergeometric test showing enriched hallmark pathways per ERBS subgroup. Bar colors reflect adjusted P-values, with gray indicating nonsignificance (>0.05).
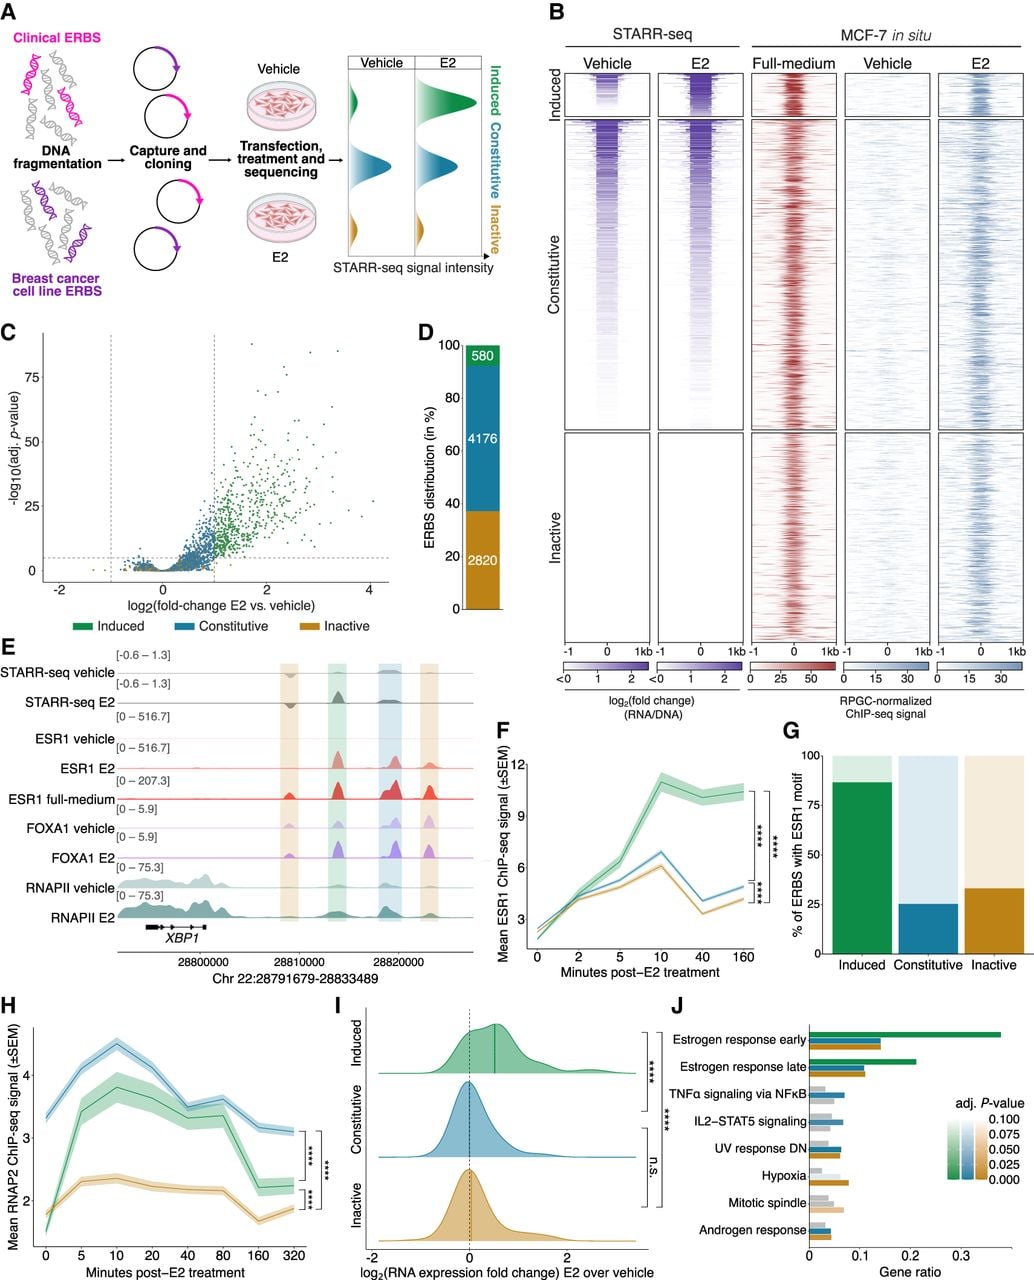
To determine enhancer activity of ESR1 binding sites, this library was transfected into MCF-7 cells which were treated with 10 nM E2 for 6 h. RNA-seq data showed excellent reproducibility across biological replicates (Pearson correlation coefficient: 0.98–1) (Supplemental Fig. S1B,C). To focus on relevant ERBS in our analysis, we retained only those identified by ChIP-seq in MCF-7 cells (Ross-Innes et al. 2012), excluding any sites absent in this cell line. This yielded 7576 unique sites representative of ESR1 chromatin binding under both full-medium (Ross-Innes et al. 2012) and E2 conditions (10 min stimulation) (Fig. 1B; Guertin et al. 2014), also enriching for commonly shared ESR1 sites in breast tumors (Supplemental Fig. S1D).
As in similar studies on androgen receptor (AR; also known as NR3C4) in prostate cancer cells (Huang et al. 2021) and glucocorticoid receptor (known as GR, encoded by NR3C1) in lung adenocarcinoma cells (Vockley et al. 2016), ERBS exhibit three distinct categories of behavior: (1) ERBS with increased activity upon E2 treatment (E2-induced); (2) ERBS active independently of E2 (constitutively active); and (3) ERBS with no detectable enhancer activity (inactive) (Fig. 1B,C; Supplemental Table 1). Constitutive ERBS were most frequent (4176 sites, 55%), followed by inactive (2820 sites, 37%) and induced sites (580 sites, 8%) (Fig. 1D). STARR-seq signal at the XBP1 locus, a well-established ESR1 target gene (Carroll et al. 2005), exemplifies all three classes (Fig. 1E). ESR1 recruitment dynamics in MCF-7 (data obtained from the NCBI Gene Expression Omnibus [GEO; https://www.ncbi.nlm.nih.gov/geo/] under accession number GSE54855) (Guertin et al. 2014) revealed similar time kinetics across ERBS categories, but induced sites showed stronger signal (Fig. 1F). Whereas 80% of induced ERBS sequence matched the consensus ESR1 motif, only 25%–30% of constitutive and inactive ERBS did (Fig. 1G).
To assess the correlation between STARR-seq-based ERBS annotation and enhancer activity within the native chromatin context, we analyzed GRO-seq signal (GEO; GSE27463) (Hah et al. 2011) at ERBS following E2 stimulation, as enhancer transcription is a well-established readout of enhancer activity (Hah et al. 2011; Zhu et al. 2013; Wang et al. 2018). Our STARR-seq-based annotations were fully supported by the GRO-seq data: whereas GRO-seq signal was initially low at induced and inactive sites, E2 treatment specifically increased the GRO-seq signal over time at induced ERBS. In contrast, constitutive ERBS exhibited GRO-seq signal prior to E2 with modest changes after E2 stimulation (Supplemental Fig. S1E). We confirmed these results with RNAPII ChIP-seq data from an E2 time course data set (GEO; GSE62789) (Honkela et al. 2015), which closely mirrored GRO-seq results and reinforced our ERBS annotation: RNAPII occupancy remained low at inactive ERBS, increased at induced sites upon E2 treatment, and was consistently high at constitutively active regions (Fig. 1H). Collectively, these findings demonstrate that STARR-seq plasmid-based measurements reliably reflect the endogenous transcriptional activity of ERBS.
To determine whether ERBS categories translated into differential gene expression, we linked ERBS to their target genes using ATAC-seq-derived peak-to-gene maps in breast tumors (Corces et al. 2018) and analyzed gene expression after 24 h E2 stimulation in MCF-7 cells (GEO; GSE99680) (Chi et al. 2019). Genes associated with constitutive and inactive ERBS were largely unresponsive to E2 (median fold changeE2/DMSO = 0.99 and 1.02, respectively), whereas genes associated with induced ERBS showed increased expression following E2 exposure (median fold changeE2/DMSO = 1.43) (Fig. 1I). Similar patterns were also seen when considering nearest genes (Supplemental Fig. S1F). Gene Ontology analysis revealed a higher enrichment at induced ERBS targets for hallmark early and late ESR1-responsive genes, whereas constitutive/inactive ERBS were linked to other signaling pathways as well (Fig. 1J), suggesting functional distinctions between categories.
Altogether, these results demonstrate that STARR-seq reliably recapitulates ERBS transcriptional behavior in situ and that only a small subset of ESR1-bound sites gain enhancer activity in response to E2.
ERBS subtypes exhibit distinct clinical associations in breast cancer
To determine whether our enhancer annotation represents clinical ESR1 activity, we utilized publicly available ATAC-seq data from breast tumors generated by the TCGA consortium to establish chromatin accessibility across the different ERBS categories (Corces et al. 2018).
Constitutively active ERBS exhibited higher chromatin accessibility in breast tumors than both induced and inactive ERBS (Supplemental Fig. S2A). Chromatin at induced ERBS was largely inaccessible in ESR1-negative tumors and became accessible only in ESR1-positive tumors. In contrast, chromatin accessibility at constitutive and inactive ERBS remained accessible regardless of ESR1 status (Supplemental Fig. S2A). These findings suggest that ESR1 action is crucial for accessibility at induced ERBS, whereas constitutive and—to a lesser degree—inactive ERBS remain accessible independently of ESR1 and may be regulated by other factors. Chromatin accessibility across ERBS subsets was not affected by tumor histology (invasive lobular carcinoma vs. invasive ductal carcinoma) (Supplemental Fig. S2B). We next examined chromatin accessibility across molecular subtypes, as defined by PAM50 (Perou et al. 2000; Parker et al. 2009): basal-like/triple-negative (TNBC, 12 samples), HER2-positive (10 samples), luminal A (30 samples), and luminal B (15 samples). Accessibility at constitutive and inactive ERBS remained relatively consistent across the different ESR1-expressing tumor types, whereas induced ERBS showed much greater variability (Fig. 2A). Notably, induced ERBS were most accessible in luminal tumors. This accessibility pattern at induced ERBS was minimal or absent in other ERBS groups. These observations suggest that the activity of ERBS subgroups varies across tumor subtypes, with induced ERBS displaying the most variability between subtypes.
ERBS subgroups are associated with clinical subtypes and patient outcome. (A) Average ATAC-seq signal (top and bottom) at ERBS subgroups across PAM50 breast cancer subtypes. Higher signals indicate higher chromatin accessibility. Significance of paired Wilcoxon test is indicated. Bottom panel shows signal normalized to basal subtype. (B) Proportion of ERBS subgroups overlapping with peaks associated to good (dark) or poor outcome (light) (Ross-Innes et al. 2012). (C) Mean ESR1 ChIP-seq signal at ERBS, from patients with good (dark) and poor (light) outcomes (Ross-Innes et al. 2012).
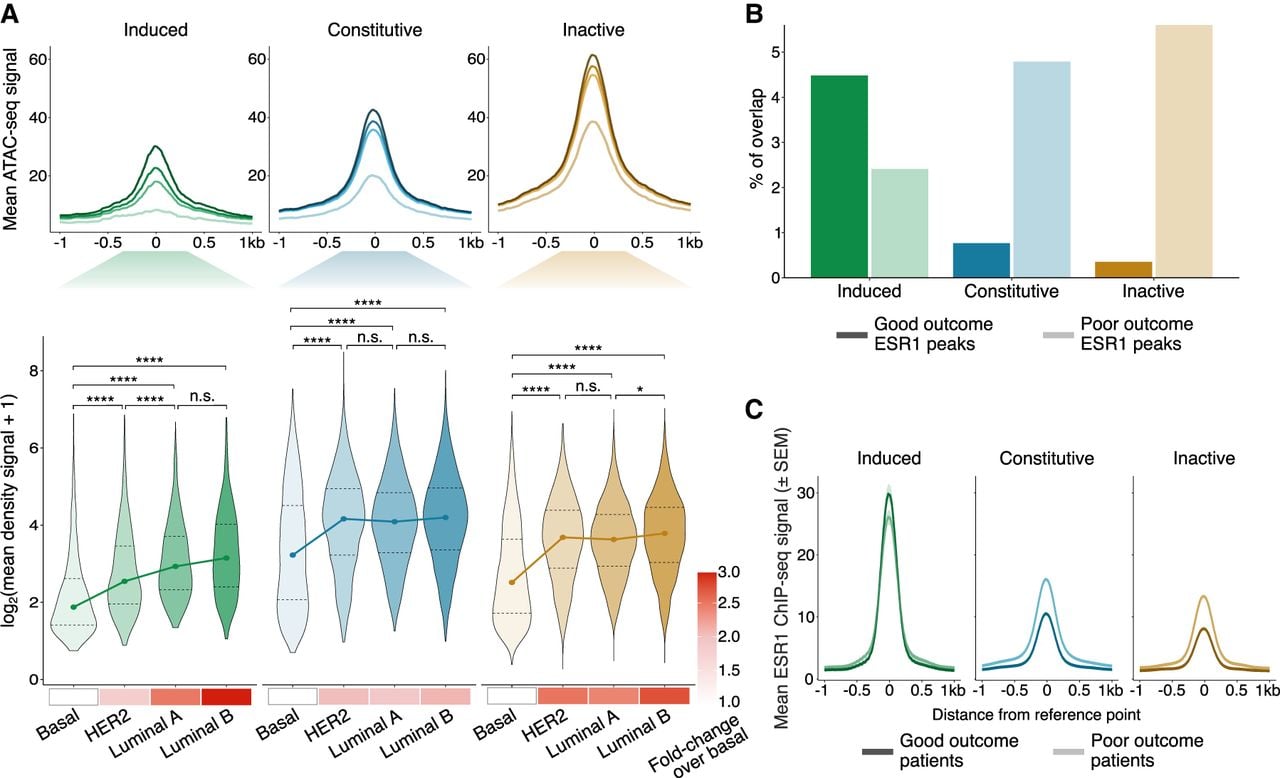
Prior studies have demonstrated that ESR1 binding sites can stratify patients on outcome and response to endocrine therapy (Ross-Innes et al. 2012; Jansen et al. 2013; Severson et al. 2016, 2018). To explore this further, we determined the prognostic relevance of our ERBS classes (Ross-Innes et al. 2012). Induced ERBS overlapped more frequently with ESR1 peaks linked to favorable prognosis, whereas constitutive and inactive ERBS were enriched for peaks associated with poor outcome (Fig. 2B; Supplemental Table 2). Moreover, ESR1 signal at constitutive and inactive ERBS, but not induced ERBS, was stronger in patients with poor prognosis compared to those with good prognosis (Fig. 2C). These data underscore distinct breast cancer prognostic associations between ERBS subgroups.
Breast cancer outcome is associated with distinct copy number variations (CNVs) (Kumaran et al. 2017; Wilcox et al. 2023). Using CopywriteR (Kuilman et al. 2015), which infers DNA copy from off-target sequencing reads, we reanalyzed ESR1 ChIP-seq data sets from normal breast tissue, primary tumors, liver metastases, and breast recurrences from four partially matched ESR1-positive breast cancer patients (EGA; EGAD50000000642). CNVs were more frequent at constitutive and inactive ERBS than at induced ERBS, particularly in primary tumors and liver metastases (Supplemental Fig. S2C,D). To validate this observation in a larger cohort, we applied CopywriteR to ESR1 ChIP-seq data from 31 ESR1-positive primary breast tumors (Ross-Innes et al. 2012; Jansen et al. 2013; Severson et al. 2018; Joosten et al. 2024). We again found that constitutive and inactive ERBS were more frequently located in amplified regions than induced ERBS (Supplemental Fig. S2E,F).
In summary, functional distinctions among ERBS categories are reflected in their clinical relevance. Their association with tumor subtypes and clinical outcome supports their possible differential involvement in breast cancer progression.
ERBS subgroups are characterized by distinct chromatin features
We next investigated the genomic and epigenetic features that distinguish ERBS subgroups. First, we tested whether STARR-seq, a plasmid-based assay devoid of endogenous chromatin context, is associated with distinct epigenetic features for the same regions when studied in situ. For that, we evaluated chromatin accessibility at ERBS using ATAC-seq in MCF-7 stimulated or not with E2 for 45 min (GEO; GSE117943) (Guan et al. 2019). Constitutively active and inactive ERBS exhibited accessibility prior to ESR1 activation with no marked increase upon E2 treatment (Fig. 3A), though constitutive ERBS were generally more accessible, consistent with primary tumor data (Supplemental Fig. S2A). In contrast, induced ERBS displayed a clear increase in accessibility following E2 stimulation (Fig. 3A), reinforcing the notion that ESR1 is required for chromatin accessibility at induced ERBS but not at other classes. These patterns are exemplified at the TFF1 locus, a classical ESR1 target gene (Fig. 3B; Berry et al. 1989). Although ERBS were predominantly located in introns and distal intergenic regions, constitutive ERBS were more frequently found at promoters compared to the other groups (Fig. 3C). To confirm this, we applied ChromHMM, a multivariate hidden Markov model algorithm that integrates histone mark ChIP-seq data into functional chromatin states (Ernst and Kellis 2017). Genome segmentation into six states confirmed that constitutively active ERBS were more often found in active promoters, both in E2-treated (Fig. 3D; Supplemental Table 3) and full-medium conditions (Supplemental Fig. S3).
ERBS subgroups display distinct chromatin landscapes. (A) Heat map (bottom) and average density profile (top) of ATAC-seq signal at ERBS in MCF-7 cells treated with DMSO (light) or E2 (dark) for 45 min (GSE117943) (Guan et al. 2019). (B) ATAC-seq signal snapshot at the TFF1 locus. Green, blue, and yellow boxes represent induced, constitutive, and inactive ERBS, respectively. Numbers represent signal intensity. (C) Pie chart depicting the genomic distribution of ERBS subgroups. (D) Left: Heat map of chromatin state emission parameters (E2-treated MCF-7), with rows as chromatin states and columns as histone marks. The color intensity reflects the coverage enrichment. Right: Distribution of ERBS subgroups across active (red) and repressive (blue) chromatin states. List of external data sets used is given in Supplemental Table 3. (E) Heat map of overlap between ERBS subgroups and 73 histone mark data sets (Supplemental Table 4). Active (red) and repressive (blue) histone marks are indicated. (F) Average density profiles for H3K4me1, H3K4me2, H3K4me3, and H3K27ac at ERBS in MCF-7 under vehicle, E2, or full-medium conditions. Green, blue, and yellow lines represent induced, constitutive, and inactive ERBS, respectively. List of external data sets used is given in Supplemental Table 5.
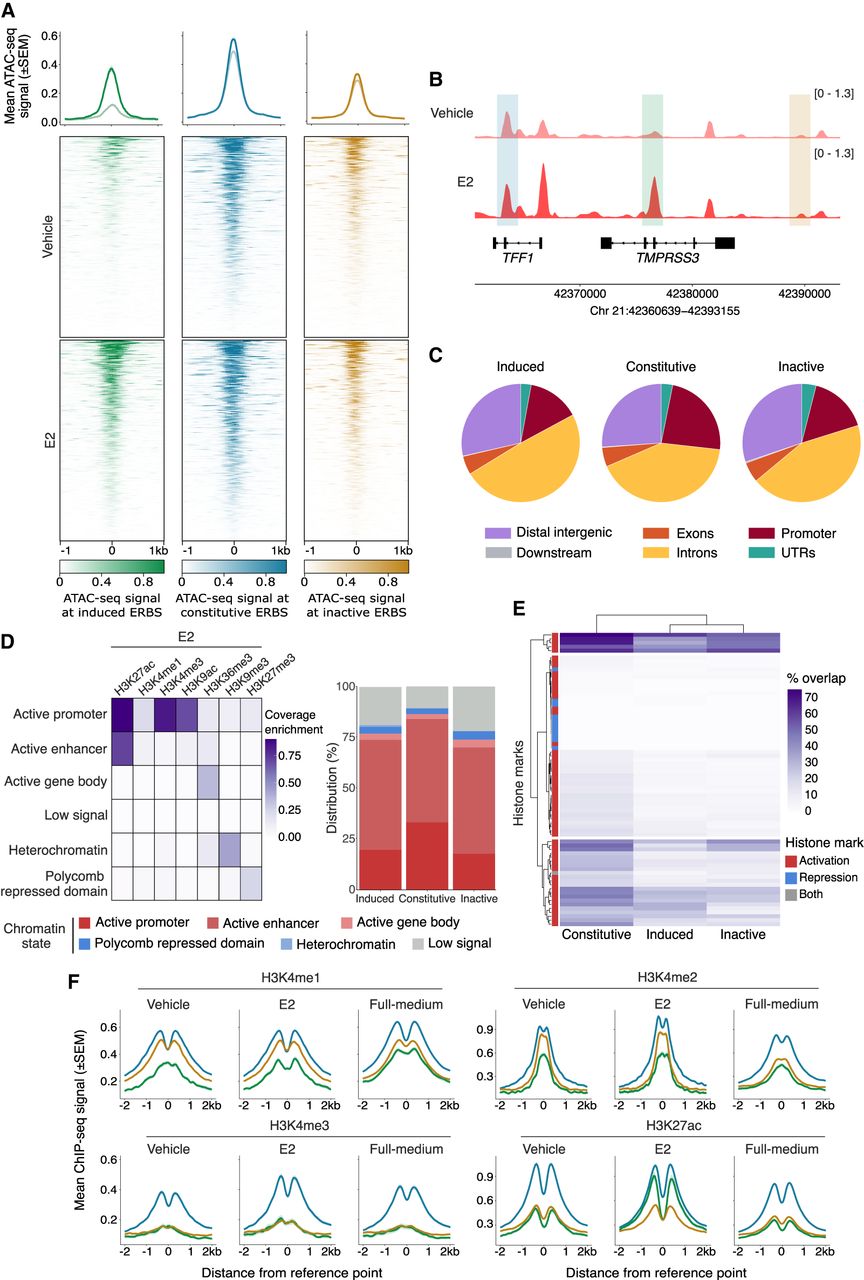
To further explore histone modifications associated with ERBS, we collected MCF-7 histone mark ChIP-seq data sets from the Cistrome Data Browser (Taing et al. 2024), covering a range of conditions (estrogen-depleted, E2-treated, full-medium), and overlapped them with our ERBS categories. Unsupervised clustering confirmed that only active histone modifications overlapped ERBS, with a notable enrichment at constitutive ERBS (Fig. 3E; Supplemental Table 4), specifically concerning classical active marks H3K27ac, H3K4me1, H3K4me2, and H3K4me3 (Supplemental Fig. S4A). Averaging signals across all public data sets (Supplemental Table 5) confirmed that signal for these marks was significantly stronger at constitutive ERBS (Fig. 3F; Supplemental Fig. S4B). We found that H3K4me1 and H3K4me2 signals were higher at inactive than at induced ERBS under all experimental conditions, despite inactive sites lacking enhancer activity. Although the reason for this remains unclear, these modifications may act as repressors (Pekowska et al. 2011; Cheng et al. 2014) or prevent subsequent acetylation (Latham and Dent 2007). Among all marks, only H3K27ac dynamics seemed to predict ERBS category, with varying degrees of E2-independent signals in constitutive and inactive regions but higher signal in induced sites when treated with E2.
Overall, ERBS classes differ in chromatin accessibility and specific histone modification profiles, with H3K27ac being the only dynamic mark predictive of ERBS activity.
Differential cofactor interactions characterize ERBS subtypes
ESR1 regulates transcription by recruiting and interacting with cofactors. We therefore investigated whether the different ERBS activities observed in the STARR-seq assay reflect differences in ESR1 complex composition. To this end, we used ATAC-seq data to compute footprinting scores for 964 transcription factor motifs in the three ERBS categories. Footprinting scores infer protein-DNA interactions by identifying genomic regions where DNA-binding proteins protect DNA from transposase cleavage (Bentsen et al. 2020). Constitutive and inactive ERBS shared a similar pattern, with footprinting scores highly similar with or without E2 (linear regression slopes = 1.03 and 0.99, respectively; Pearson's correlation R = 0.97 for both groups), suggesting minimal transcription factor recruitment upon E2 treatment at these sites (Fig. 4A). However, constitutive ERBS exhibited generally higher footprinting scores than inactive ones, suggesting greater transcription factor occupancy, consistent with their relatively higher accessibility and activity. In contrast, induced ERBS showed low footprinting scores under unstimulated conditions, consistent with lower chromatin accessibility at these sites. However, footprinting scores markedly increased at these sites upon E2 treatment (linear regression slopes = 1.51; Pearson's correlation R = 0.85), indicating robust transcription factor recruitment. Therefore, ERBS subgroups display different patterns of co-occupancy with other factors.
Differential cofactor interactions characterize ERBS subtypes. (A) Transcription factor footprinting scores in MCF-7 cells treated with vehicle or E2 (45 min), averaged across ERBS subgroups for 964 motifs. Linear regression slopes (m), correlation (R), and P-values indicate changes upon E2 treatment. (B) Dot plot of top 20 enriched motifs at ERBS. Dot size reflects motif frequency; color indicates the –log10(adj.P-value). Selected Forkhead motifs (FOXA2, FOXA3, FOXP1, and FOXP2) were excluded to reduce redundancy. (C) 3D-plot of χ2 test residuals for overlap of 280 ReMap2022 ChIP-seq data sets. Residuals indicate deviation from expected distribution among the three ERBS subgroups. Colors represent the –log10 of the P-value from the χ2 test. ChIP-seq data sets and statistics are provided in Supplemental Table 6. (D) Bar plots showing overlap of top coregulators with induced (top) and constitutive (bottom) ERBS. (E) Heat map of 280 coregulator ChIP-seq data sets (x-axis) binding across induced ERBS (y-axis). Green indicates binding of the coregulator at the given induced ERBS; white indicates absence of binding. A high-occupancy cluster is indicated by a red line (bottom left). (F) Percentage overlap of ERBS subgroups with coregulators from the red cluster in E.
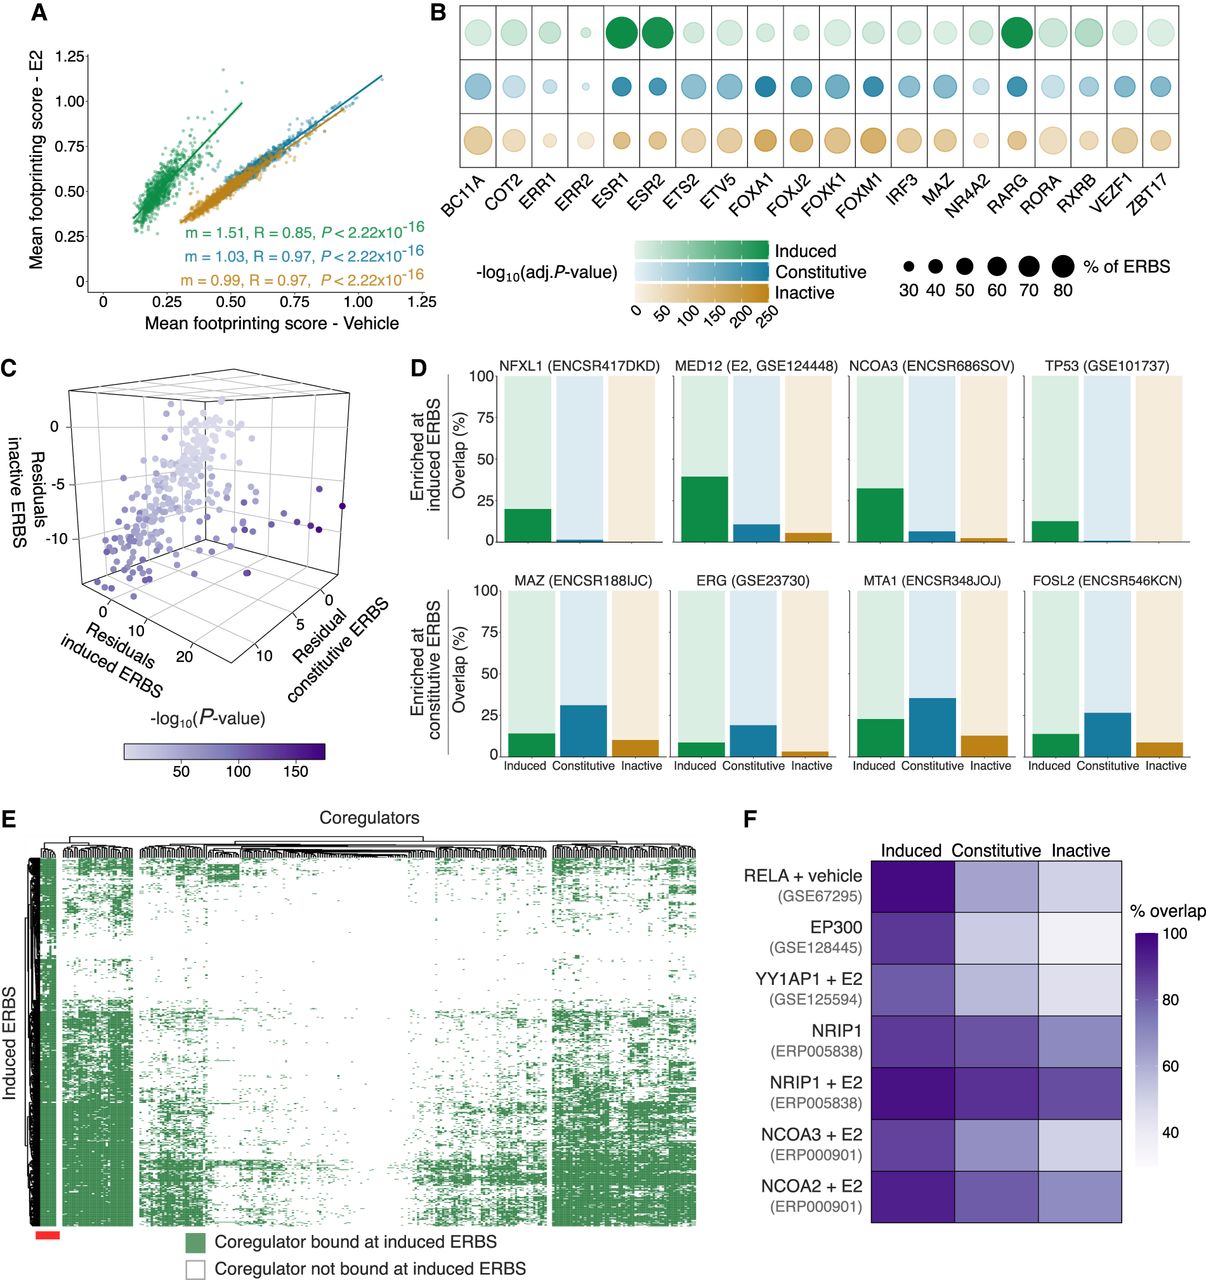
To further explore which factors differentially associate with each ERBS class, we performed motif enrichment analysis. Constitutive and inactive sites were predominantly enriched for motifs recognized by the forkhead family transcription factors, whereas these motifs were less represented at induced sites (Fig. 4B). Conversely, induced ERBS were strongly enriched for ESR1 and RARG motifs. However, given the similarity between the RARG motif and the ESR1 half-site (Supplemental Fig. S5A), and the uniform overlap of RARG ChIP-seq peaks across all ERBS groups (Supplemental Fig. S5B), RARG likely does not play a distinguishing role.
We next sought to identify ESR1 cofactors that define each ERBS class. We downloaded 280 ChIP-seq data sets from the ReMap2022 database (Hammal et al. 2022), all derived from MCF-7 cells (Supplemental Table 6), and performed overlap analyses with our ERBS subgroups. These ChIP-seq data sets were generated under heterogeneous experimental conditions, including E2-depleted, E2-stimulated, and full-medium conditions. To evaluate enrichment, we computed the proportion of overlaps between transcriptional regulator peaks and ERBS classes and applied a χ² test for homogeneity, using the resulting residuals to highlight over- or under-representation (see Methods). The global χ² analysis revealed that inactive ERBS were characterized by predominantly negative χ² residuals, indicating depletion of transcriptional regulator binding compared to the other two groups (Fig. 4C; Supplemental Fig. S5C). In contrast, constitutively active and especially induced ERBS were enriched for transcriptional regulator binding. Among the top enriched factors at induced ERBS were canonical ESR1-interacting proteins such as NCOA3 (Zwart et al. 2011), CARM1 (Yi et al. 2017), MED1 (Kang et al. 2002), as well as the less-characterized factor NFXL1. Constitutively active ERBS were preferentially bound by members of the AP-1 complex (JUN, JUNB, JUND, ATF7, and FOSL2) along with MAZ and ERG (Fig. 4D; Supplemental Table 6).
Whereas this approach identified factors enriched in specific ERBS groups, it did not capture the most prevalently associated factors. For instance, TP53 was strongly enriched at induced ERBS relative to other categories but was present at only 13% of induced sites (vs. 0.8% and 0.1% of constitutive and inactive ERBS, respectively) (Fig. 4D). We therefore performed clustering analysis to identify factors with broad coverage of induced ERBS. We found six transcriptional regulators present at >80% of induced ERBS (range: 80.2%–97.6%) (Fig. 4E; Supplemental Table 6): RELA, EP300, YY1AP1, NRIP1, NCOA2, and NCOA3, with preferential binding to this subgroup (Fig. 4F). In contrast, SMARCB1, SMARCA4, and HDAC2 were more frequently associated with constitutively active ERBS, although they were also present in the other classes (Supplemental Table 6). The same was true for FOXA1, consistent with motif enrichment results (Fig. 4B).
Altogether, our integrative analysis of publicly available ChIP-seq data reveals distinct cofactor landscapes at ERBS subgroups.
ERBS groups are associated with distinct long-range chromatin looping features
ERBS are mostly found at putative enhancer regions rather than promoters (Carroll et al. 2005). As estrogen stimulation reorganizes 3D genome architecture, facilitating long-range genomic interactions to modulate gene transcription, we next investigated whether the three ERBS categories display distinct patterns of chromatin interactions.
To explore this, we used high-throughput chromosome conformation capture (Hi-C) in MCF-7 cells under full-medium conditions (GEO; GSE244845) (Joosten et al. 2024). Hi-C provides a comprehensive mapping of long-range chromatin interactions and insights into chromatin architecture. Using Aggregate Region Analysis (ARA) centered on each ERBS category, we observed distinct contact profiles (Fig. 5A). Constitutive and inactive ERBS exhibited a higher frequency of short-range contacts and fewer long-range interactions, particularly for constitutive ERBS, consistent with their promoter-proximal enrichment. In contrast, induced ERBS were more frequently engaged in long-range chromatin interactions, suggesting greater involvement in chromatin looping and spatial genome organization.
ERBS groups are associated with distinct long-range chromatin looping features. (A) Aggregate Region Analysis of Hi-C data in MCF-7 cells shows how ERBS groups contribute to long-range chromatin interactions. (B) Percentage of ERBS involved in chromatin interactions from ESR1 ChIA-PET data (Encode, ENCSR000BZZ) (Fullwood et al. 2009). Error bars represent the standard error of the mean from three replicates. (C) Distribution of chromatin interaction distances involving ERBS. Dashed lines indicate median distances for each group. Significance of Wilcoxon test is indicated. (D) Number of loops per ERBS subgroup. Dashed lines represent subgroup means. Significance of Wilcoxon test is indicated. (E) Venn diagram showing overlap of genes looped by ERBS subclasses, based on ESR1 ChIA-PET data. Genes connected by at least two out of the three biological replicates were kept. (F) Snapshot of ERBS “hubs.” Green, blue, and yellow boxes represent induced, constitutive, and inactive ERBS, respectively. Colored arcs represent subgroup-specific loops identified by ESR1 ChIA-PET.
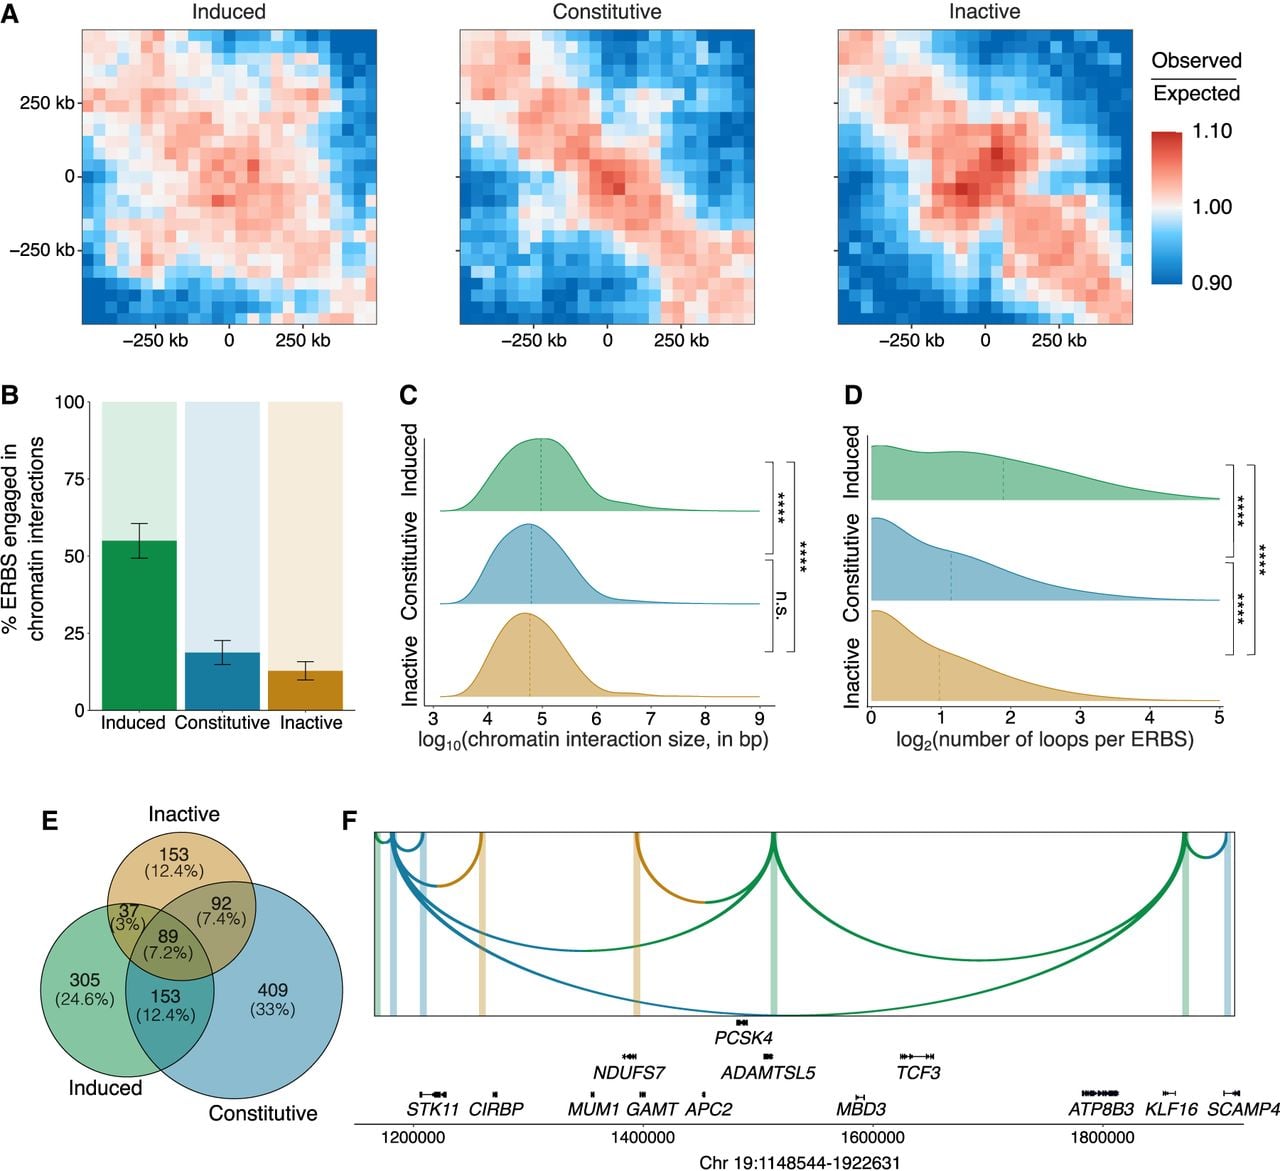
To validate these findings, we used ESR1 ChIA-PET data (ENCODE, ENCSR000BZZ) (Fullwood et al. 2009), which directly detects ESR1-mediated chromatin interactions. In agreement with the Hi-C results, induced ERBS participated in more frequent and longer-range interactions compared to other categories (median interaction sizes: induced ERBS = 94,927 bp; constitutive ERBS = 63,251 bp; inactive ERBS = 58,867 bp) (Fig. 5B,C).
Single enhancers can participate in multiple distinct chromatin loops (Allahyar et al. 2018). Induced ERBS formed significantly more chromatin contacts than other groups (mean contacts per site: induced ERBS = 3.72; constitutive ERBS = 2.21; inactive ERBS = 1.97) (Fig. 5D). Although constitutive ERBS were enriched at promoters (Fig. 3C), ERBS-associated contact regions were broadly distributed across the genome (Supplemental Fig. S6A).
Genes looped to inactive ERBS were least likely to be exclusively looped to a single ERBS category (40%, compared to 50% for induced and 60% for constitutive ERBS) (Fig. 5E). Approximately 30% of genes looping to an ERBS were contacted by at least two ERBS categories and 7% to all three (Fig. 5E,F). Similar proportions were observed for ERBS associated with promoters only (Supplemental Fig. S6B). This suggests that ERBS from distinct categories can converge in 3D genome “hubs,” involved in gene regulation. Notably, inactive ERBS—despite lacking inherent enhancer activity—were most frequently involved in such hubs. Collectively, through STARR-seq and chromatin interaction analyses, we have demonstrated that the different ERBS categories, as identified in plasmid-based readouts, exhibit distinct 3D genome features.
Together, these analyses show that the three ERBS classes identified by the plasmid-based readout exhibit distinct spatial genome features in situ.
Discussion
Throughout evolution, gene regulation has provided remarkable versatility of our genetic material, enabling cell- and tissue-specific expression programs to emerge from the same genome. Selective activity of enhancers has emerged as a central contributor to the spatiotemporal control of gene expression. In cancer, we and others reported that enhancer activity undergoes extensive reprogramming, reflecting a high degree of epigenetic plasticity during tumor development (Pomerantz et al. 2015; Mazrooei et al. 2019), progression (Stelloo et al. 2015; Pomerantz et al. 2020; Severson et al. 2021), and therapy response (Jansen et al. 2013; Baca et al. 2021; Linder et al. 2022). Given the enrichment of steroid hormone receptors at enhancer elements and their ability to mediate long-range chromatin interactions (Fullwood et al. 2009; Hsu et al. 2010), 3D genome organization likely plays a critical role in orchestrating hormone-dependent transcriptional programs.
To investigate the molecular determinants underlying enhancer activity heterogeneity in cancer, we focused on breast cancer and its key driver, ESR1. Using MCF-7 cells and a massively parallel reporter assay for enhancer activity (STARR-seq), we analyzed the intrinsic regulatory potential of thousands of ESR1 binding sites and revealed a striking conservation of their regulatory potential and hormone responsiveness, even outside of their native genomic context. We found that only a small subset of ERBS exhibited E2-dependent activity (8%), whereas 55% were constitutively active, and 37% remained inactive. These results parallel similar observations made for AR in prostate cancer (Huang et al. 2021) and GR in lung cancer cells (Vockley et al. 2016), suggesting that the limited number of hormone-responsive enhancers is an intrinsic feature of steroid hormone receptor action. It is important to note that our results reflect ESR1 activation at a single dose and time point of E2 stimulation. This static snapshot may not fully capture the rapid and dynamic nature of ESR1 binding to DNA in its native context (Shang et al. 2000; Guertin et al. 2014; Murakami et al. 2017), as protein levels of ESR1 itself are directly affected by E2 stimulation (Nawaz et al. 1999). Alternatively, some regulatory elements may not maintain their activity outside of their genomic context. Although these limitations should be considered when interpreting our results, our findings remain highly consistent with profiles of RNAPII ChIP-seq and GRO-seq, gene expression data, and chromatin accessibility in both MCF-7 and breast tumors. These data reinforce the relevance of our ERBS functional annotation and provide a framework for dissecting the distinct regulatory behaviors of enhancer subtypes.
Although we identified three distinct classes of ERBS, our primary focus centered on E2-inducible sites, as they directly reflect estrogen signaling in breast cancer cells. However, we also uncovered critical distinguishing features between constitutive and inactive ERBS, despite their shared E2 independence, localization within pre-accessible chromatin, and weak ESR1 motif enrichment. Notably, constitutive ERBS are more frequently enriched at promoters compared to inactive ERBS, consistent with their higher levels of H3K4me3, a mark associated with active promoters (Bernstein et al. 2005; Heintzman et al. 2007). Constitutive ERBS also display enrichment for additional histone modifications typically linked to regulatory element activity, including H3K27ac, H3K4me1, and H3K4me2, and exhibit higher coregulator occupancy. These features provide a molecular basis for their distinct enhancer activities observed in STARR-seq, RNAPII, and GRO-seq data. Despite these differences, constitutive and inactive ERBS may still serve common regulatory roles. Prior studies in prostate cancer have shown that targeting both constitutive and inactive AR binding sites can suppress androgen-induced transcription (Huang et al. 2021), raising the possibility of a similar model for ESR1. Supporting this, we found that 30% of ESR1-linked genes were associated with multiple ERBS classes, suggesting that all three enhancer types may participate in gene regulation in a context-dependent manner.
Beyond validating our ERBS annotation through orthogonal in vitro data sets, we found that enhancer classes also align with clinically relevant features of ESR1 biology. In patient tumors, induced ERBS displayed minimal chromatin accessibility in ESR1-negative tumors but were clearly accessible in ESR1-positive tumors, whereas constitutive and inactive ERBS remained accessible regardless of ESR1 status. A similar trend was observed in MCF-7 cells, where E2 treatment selectively increased accessibility at induced ERBS. This suggests that induced ERBS are directly controlled by ESR1 activity and are selectively engaged in ESR1-expressing tumors. Given the ability of nuclear receptors to bind closed chromatin and facilitate the recruitment of pioneer factors and chromatin remodelers at particular regions (Miranda et al. 2013; Johnson et al. 2018; Paakinaho et al. 2019), ESR1 may have the ability to promote chromatin opening, selectively at induced ERBS. Overall, our data reinforce the notion that enhancer activity, rather than ESR1 binding alone, serves as a more informative marker of estrogen receptor function and tumor biology.
A striking observation from patient samples was that ESR1 binding at different enhancer classes correlated with distinct patient outcomes. Constitutive and inactive ERBS are more frequently associated with poor prognosis, whereas induced ERBS were preferentially occupied in patients with favorable outcomes. These findings align with our previous study on ESR1 ChIP-seq in human tumors, showing ESR1 motifs enrichment at sites detected in patients who responded to aromatase inhibition, whereas additional transcription factor motifs were observed for ESR1 sites detected in nonresponders (Jansen et al. 2013). The presence of other factors at these sites may render the transcriptional activity ESR1-independent, despite ESR1 binding at these regions. As such, these sites could sustain tumor growth despite endocrine therapy, contributing to treatment resistance. These findings reinforce the well-established role of ESR1 as a key driver of breast cancer progression and suggest that not all ERBS classes contribute equally to its functional impact in the disease.
Our results reveal fundamental differences across ERBS classes in terms of motif enrichment, transcription complex composition, histone mark profiles, and long-range chromatin interactions. Jointly, these data support a model in which ERBS subclasses engage chromatin differently and serve distinct regulatory functions (Fig. 6). First, hormone-dependent ESR1 sites are more likely to serve as canonical enhancers, containing the consensus ESR1 motif and directly binding ESR1 to loop to target genes. Although FOXA1 is a well-established pioneer that facilitates ESR1 binding by opening chromatin (Hurtado et al. 2011), our results suggest that it is not the primary determinant distinguishing ERBS subgroups. Instead, we found that distinct coregulators were enriched at induced ERBS, several of which enhance ESR1 activity (Hanstein et al. 1996; Zwart et al. 2011; Rosell et al. 2014; Franco et al. 2015). Secondly, inactive ESR1 sites, largely devoid of coregulators, frequently interact with other ERBS and may act as modulators to fine-tune ESR1 activity (Carleton et al. 2017, 2020). Finally, promoter-enriched ERBS tend to be constitutively active and are heavily occupied by coregulators irrespective of E2 stimulation. We observed an enrichment of AP-1 complex components at these ERBS which lack strong ESR1 motifs, suggesting that AP-1 may tether ESR1 to these regions, as previously described (Carroll et al. 2006; Stender et al. 2010; Heldring et al. 2011; He et al. 2018). It is important to note that additional mechanisms of ESR1 action could be at play. For instance, unliganded ESR1 has been shown to prime ERBS for activation (Saravanan et al. 2020), although such events could not be captured in our experimental setup.
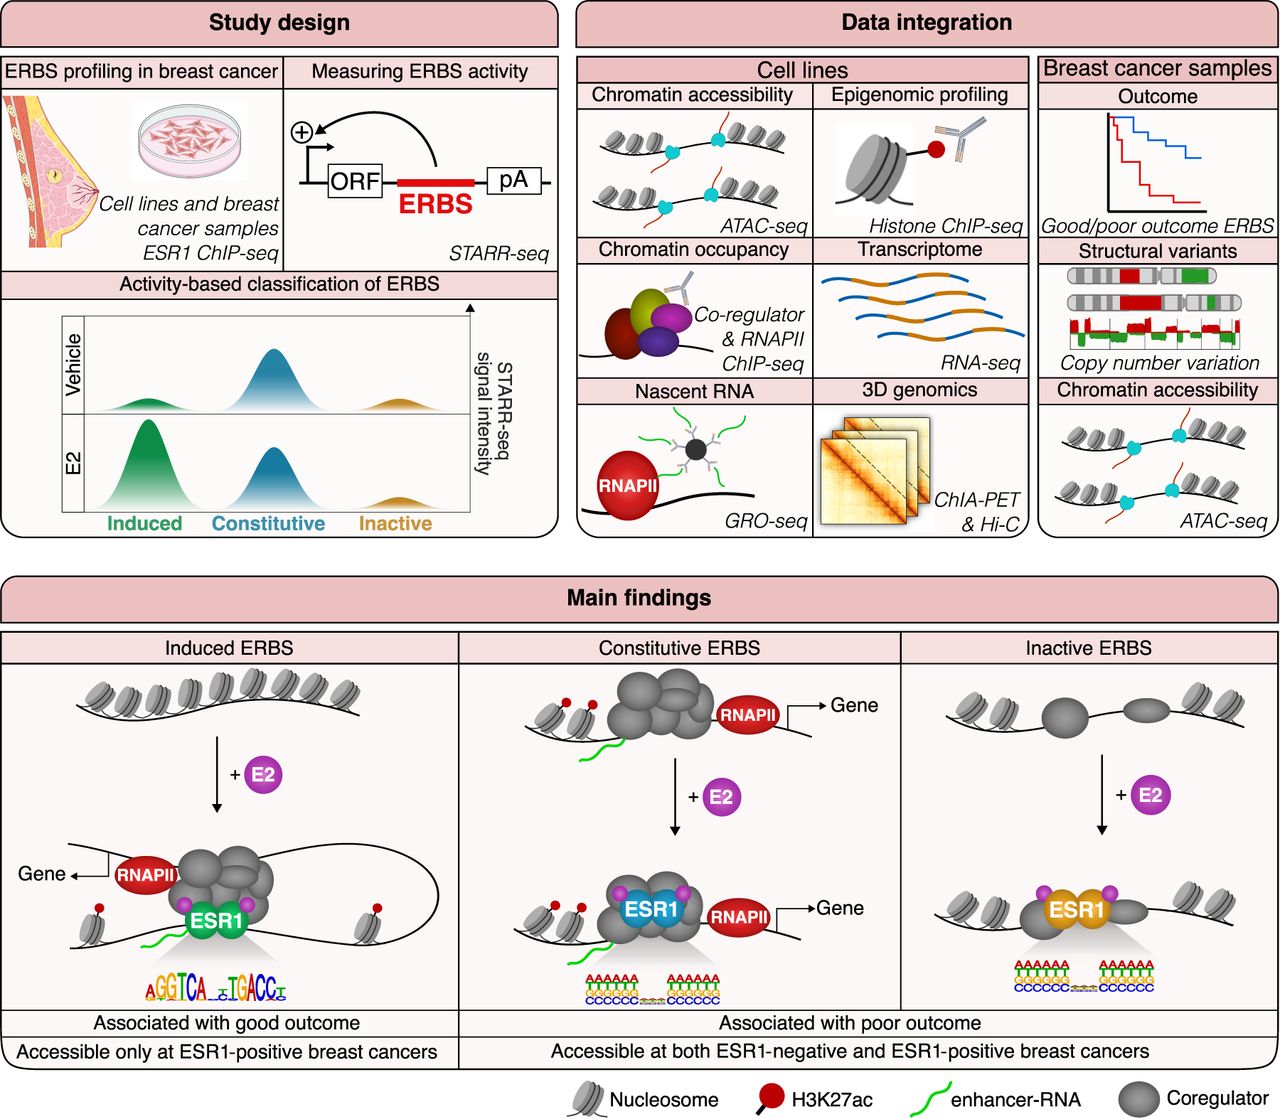
Summary of study design, data integration, and main findings. (Top left) ESR1 binding sites were identified from ESR1 ChIP-seq data in cell lines and breast cancer samples. The activities of 14,299 ERBS were then assessed using STARR-seq. After excluding uncommon sites, 7576 ERBS were classified into three groups: (1) E2-induced ERBS, with increased activity upon E2; (2) constitutively active ERBS, with E2-independent activity; and (3) inactive ERBS, with no detectable enhancer activity. (Top right) Publicly available multi-omic data from MCF-7 cells and patient samples were integrated to define molecular features of each ERBS subgroup. (Bottom) Induced ERBS become accessible upon E2 stimulation and showed ESR1 motif enrichment, E2-driven H3K27ac signal gain, distinct coregulator recruitment, and strong enhancer and transcriptional activity. Constitutive and inactive ERBS reside in pre-accessible chromatin and rarely contain an ESR1 motif. Unlike inactive ERBS, constitutive ERBS are prebound by coregulators and associated with enhancers, promoters, and transcriptional activity. Clinical data integration reveal that ERBS subclasses were associated with distinct breast cancer subtypes and clinical outcomes, with induced ERBS more frequently associated with a favorable prognosis, whereas the other subclasses correlated with poor outcome.
Although our use of multiple external data sets strengthened the robustness of our findings, it also introduced variability due to the heterogeneous technical conditions analyzed. Notably, growing cells in hormone-depleted conditions (i.e., dextran-coated charcoal serum) prior to E2 stimulation may disrupt pathways or factors involved in estrogen signaling, complicating comparisons with cells cultured in full-media conditions. Although our data show consistent trends in coregulator binding and chromatin annotations across these conditions, H3K27ac signal displayed different patterns between full-medium and E2 stimulation, particularly at induced ERBS. Moreover, the integration of data sets with heterogeneous durations of E2 treatment may represent a confounding factor, as the molecular events of the ESR1 pathway unfold on different timescales. Therefore, although our findings are supported by multiple orthogonal approaches both in cell lines and patient samples, we cannot exclude the possibility that some of our observations were influenced by the experimental context of the external data sets.
In conclusion, we functionally mapped the activity of thousands of ESR1 regulatory elements and highlighted their differences in the epigenomic landscape and transcription complex composition. The differential clinical outcomes associated with ERBS classes underscore their specificity and offer new insights into ESR1 signaling and its role in cancer biology.
Methods
STARR-seq data analyses
We made use of STARR-seq data previously generated in our lab (EGA; EGAD50000000015), the method for which has already been extensively described (for the detailed procedure, see Joosten et al. 2024). Briefly, a custom oligonucleotide probe pool was designed to capture ESR1 binding regions from both clinical breast tumors and T-47D cell line ESR1 ChIP-seq. Pooled human genomic DNA was sheared, captured, PCR-amplified, and cloned into the hSTARR-ORI plasmid (Addgene, plasmid 99296). The ESR1-focused STARR-seq capture library was transformed into electrocompetent cells, and the plasmid DNA was extracted. MCF-7 cells were grown for 48 h under hormone-deprivation conditions. The library was then transfected in the cells, and after 24 h, they were stimulated with 10 nM E2 for 6 h. Total RNA was extracted using TRIzol (Invitrogen), and poly(A) mRNA was isolated using the Oligo (dT)25 Dynabeads (Thermo Fisher Scientific) and reverse-transcribed into cDNA. The synthesized STARR-seq cDNA was amplified by a junction PCR, and Illumina-compatible libraries were sequenced on Illumina NovaSeq 6000 (150 bp paired-end).
Raw FASTQ reads were mapped onto hg19/GRCh37 genome build using BWA aligner (v0.7.17) aligner (Li and Durbin 2009). Aligned fragments were filtered for mapping quality greater than 30 (MAPQ > 30) using SAMtools (v1.14) (Danecek et al. 2021). BAM files were converted into BEDPE files, and fragments counts at target regions were computed using BEDTools (v2.30) (Quinlan 2014).
Differential analysis of STARR-seq data was performed using DESeq2 (v1.30.1) (Love et al. 2014). Inactive ERBS were defined as having a linear fold change of RNA over DNA in both E2 and vehicle condition lower than 1. Constitutive ERBS were defined as having a linear fold change E2/vehicle lower than 2 and adjusted P-value lower than 0.05. If the fold change E2/DMSO exceeded 2, accompanied by an adjusted P-value lower than 0.05, ERBS were considered as E2-induced.
As the library is based on regions identified in breast primary tumors and T-47D cell line ESR1 ChIP-seq experiments, some sites might be exclusive to these systems and not be active endogenously in MCF-7 cells, in which the STARR-seq has been conducted. Therefore, we filtered out ERBS that were not endogenously present in MCF-7. For that, ERBS were overlapped with ESR1 ChIP-seq from MCF-7 in full-medium conditions (GEO; GSE32222) (Ross-Innes et al. 2012) using GenomicRanges (v1.56.1) (Lawrence et al. 2013), and only common peaks were kept. We then verified that the selected subset of peaks was also representative of ERBS in MCF-7 in E2-stimulated conditions from another study (GEO; GSE54855) (Fig. 1B; Guertin et al. 2014). When necessary, ERBS BED files were lifted over from hg19 to hg38 using the UCSC liftOver tool (Haeussler et al. 2019) (https://genome.ucsc.edu/cgi-bin/hgLiftOver).
ERBS nearest genes, as well as genomic annotation of ERBS, were determined using ChIPseeker (promoter: −2 kb: TSS: +1 kb, flanking distance = 2 kb) (Yu et al. 2015). A hypergeometric test using clusterProfiler's (v3.18.1) (Wu et al. 2021) enricher function on the “Hallmarks” (H) data sets retrieved through MSigDB (v7.5.1) (Liberzon et al. 2015) was used to determine which pathways were enriched at ERBS nearest gene.
Analysis of publicly available omics data sets
Standard procedures for the analysis of publicly available ChIP-seq, RNA-seq, ATAC-seq, Hi-C, and ChIA-PET data sets are described in detail in the Supplemental Material.
Estimation of copy number variations
Copy number variations on ChIP-seq data were estimated using the SPACCa pipeline, which employs the CopywriteR R-package (Kuilman et al. 2015) (https://github.com/PeeperLab/CopywriteR). CNVs were estimated on two cohorts: (1) ESR1 ChIP-seq from four partially matched ESR1-positive breast cancer patients (EGA; EGAD50000000642); and (2) a larger cohort of 40 ESR1 ChIP-seq data sets from ESR1-positive primary breast tumors (Ross-Innes et al. 2012; Severson et al. 2018; Joosten et al. 2024). For this second cohort, only ChIP-seq samples with a peak number greater than 1000 were retained, reducing the size of the cohort to 31 samples.
Association of ERBS with histone marks and coregulator binding
All BED files from histone marks ChIP-seq in MCF-7 were downloaded from the Cistrome Data Browser (v2.0) (Taing et al. 2024). All BED files from coregulators ChIP-seq in MCF-7 were downloaded from the ReMap2022 database (Hammal et al. 2022). In both cases, files concerning MCF-7 transfected with siRNA other than control siRNA or treated with drugs other than E2 were discarded. BED files were then overlapped with ERBS using GenomicRanges. For coregulators, percentage of ERBS overlapped by each of the 280 ChIP-seq datastreams was calculated, and the χ2 goodness-of-fit test was performed to assess whether overlap is consistent across the three ERBS subgroups. Residuals from the χ2 test quantify how much the observed data deviates from the expected data under the null hypothesis of the test. Here, the null hypothesis is that there is no association between coregulators binding and the three ERBS categories (in other words, the coregulator is binding similarly across the three subgroups). Large residuals indicate a greater deviation from the expected frequency.
Association of ERBS with RNAPII, GRO-seq signal, and gene expression
To determine RNAPII occupancy at ERBS, we reanalyzed publicly available RNAPII ChIP-seq data from MCF-7 cells treated or untreated with 10 nM E2 at various time points (Honkela et al. 2015). RNAPII signal at each ERBS was quantified using computeMatrix from deepTools. The signal was then averaged across all ERBS within the same class, and density profiles were generated using the plot.density.profile function from the Rseb R-package.
A similar approach was used to assess GRO-seq signal at ERBS. However, instead of reanalyzing the raw data, we directly utilized publicly available bigWig files from GSE27463 (Hah et al. 2011).
To assign genes potentially regulated by ERBS, we used publicly available data correlating ATAC-seq peaks with putative target genes in BRCA patients (Corces et al. 2018). ATAC-seq peaks were overlapped with ERBS using GenomicRanges, allowing gene assignment to specific ERBS.
To determine whether genes associated with ERBS were responsive to E2 treatment (Fig. 1I), we analyzed publicly available RNA-seq data from MCF-7 cells treated with E2 (Chi et al. 2019). Additionally, to corroborate these findings using an alternative peak-to-gene assignment approach (Supplemental Fig. S1F), each ERBS was also mapped to its nearest gene, and the E2 sensitivity of these genes was assessed using the same RNA-seq data set.
Overlap of ERBS with outcome-associated regions
To determine whether ERBS classes were associated with patient outcomes, ESR1 peaks linked to good (599 ERBS) or poor (1192 ERBS) outcomes were obtained from publicly available data (Ross-Innes et al. 2012). The findOverlaps function from the GenomicRanges package was used to identify ERBS overlapping with these outcome-associated regions. The percentage of overlapping regions for each ERBS class was then calculated. Overlapping regions for each ERBS class can be found in the Supplemental Table 2.
To quantify the ESR1 ChIP-seq signal at ERBS based on patient outcome stratification, we downloaded and reanalyzed raw ESR1 ChIP-seq data (GEO; GSE32222) (Ross-Innes et al. 2012), as described in the “ChIP-seq analysis” section above. bigWig files from patients classified as having a good or poor outcome were averaged separately using bigWigAverage from deepTools. The resulting ESR1 ChIP-seq signal from patients with good and poor outcome was then quantified at ERBS positions for the three subclasses using plotHeatmap from deepTools. Visualization was performed using density profiles generated with the plot.density.profile function from the Rseb R-package, and signal was quantified and visualized.
Motif analysis
Motifs presence and strength at ERBS subgroups were determined using Analysis of Motif Enrichement (AME, version 5.5.7) from the MEME suite (Bailey et al. 2015). The HOCOMOCO Human v11 database was used as a reference. Visualization of the enrichment motifs was made using the ggwordcloud R package (https://github.com/lepennec/ggwordcloud) using the AME computed E-value and percentage of true positives.
Chromatin state model
We used ChromHMM v1.1.12 (Ernst and Kellis 2017) to binarize the ChIP-seq signal with default parameters and build the chromatin state model at 200-bp resolution (-b 200), using seven major histone marks: H3K27ac, H3K4me1, H3K4me3, H3K9ac, H3K36me3, H3K9me3, and H3K27me3. The model was trained to define six chromatin states. Nomenclature of these six chromatin states was established based on known histone modification functions (Zhao and Shilatifard 2019) and chromatin states previously defined by ChromHMM in breast cancer cells (Xi et al. 2018). Chromatin states were defined in MCF-7, both in full-medium and E2-stimulated conditions. For the full-medium condition, ChIP-seq FASTQ files from GSE85158 (Franco et al. 2018) were downloaded and processed as mentioned above (“ChIP-seq analysis” section). For the E2-stimulated condition, ChIP-seq FASTQ files from multiple sources, cited in Supplemental Table 3, were downloaded and processed as mentioned above. Distribution of the ERBS subgroups within the defined chromatin states was then calculated using GenomicRanges.
Statistics and computational analyses
Statistical and computational analyses have been performed using R (v4.0.3) (R Core Team 2021). The statistical tests used are indicated in each figure legend. Across all plots, significance is denoted using a common star notation: (****) P-value < 0.0001, (***) P-value < 0.001, (**) P-value < 0.01, (*) P-value < 0.05, and (n.s.) indicates nonsignificant results.
Competing interest statement
The authors declare no competing interests.
Acknowledgments
We acknowledge the NKI-AVL Core Facility Molecular Pathology & Biobanking (CFMPB) for supplying biobank material and lab support, the NKI Genomics Core Facility for Illumina sequencing and bioinformatics support, Koç University Research Center for Translational Medicine (KUTTAM) Core Labs for the use of the services and facilities, and the NKI Research High Performance Computing (RHPC) facility for computational infrastructure. We thank members of the Zwart and Bergman labs for fruitful discussions and feedback. W.Z. was funded by the Oncode Institute, which is partly financed by the Dutch Cancer Society KWF. Research at the Netherlands Cancer Institute is supported by institutional grants of the Dutch Cancer Society and the Dutch Ministry of Health, Welfare and Sport. G.K. was supported by Turkish Academy of Sciences (TUBA) GEBIP Award (2021) and The Science Academy Young Scientist Award Program (BAGEP-2021). N.A.L. was supported by funding from Türkiye Bilimsel ve Teknolojik Araştırma Kurumu (TÜBİTAK) (221Z116) and Canadian Institutes of Health Research CIHR PJT-173331.
Author contributions: Conceptualization and project funding: W.Z., N.A.L., and G.K. Experiments: E.Y., C.F.H., T.M., and U.B.A. Bioinformatics analyses: Y.Z. and S.G. Manuscript: Y.Z. Correction of the manuscript: W.Z. and S.G. Supervision: W.Z. All authors read and approved the final manuscript.
Notes
[1] Supplementary material [Supplemental material is available for this article.]
[2] Article published online before print. Article, supplemental material, and publication date are at https://www.genome.org/cgi/doi/10.1101/gr.280320.124.
References
- ↵Allahyar A, Vermeulen C, Bouwman BAM, Krijger PHL, Verstegen MJAM, Geeven G, van Kranenburg M, Pieterse M, Straver R, Haarhuis JHI, 2018. Enhancer hubs and loop collisions identified from single-allele topologies. Nat Genet 50: 1151–1160. 10.1038/s41588-018-0161-5
- ↵Andersson R, Sandelin A. 2020. Determinants of enhancer and promoter activities of regulatory elements. Nat Rev Genet 21: 71–87. 10.1038/s41576-019-0173-8
- ↵Arnold CD, Gerlach D, Stelzer C, Boryń ŁM, Rath M, Stark A. 2013. Genome-wide quantitative enhancer activity maps identified by STARR-seq. Science 339: 1074–1077. 10.1126/science.1232542
- ↵Baca SC, Takeda DY, Seo J-H, Hwang J, Ku SY, Arafeh R, Arnoff T, Agarwal S, Bell C, O'Connor E, 2021. Reprogramming of the FOXA1 cistrome in treatment-emergent neuroendocrine prostate cancer. Nat Commun 12: 1979. 10.1038/s41467-021-22139-7
- ↵Bailey TL, Johnson J, Grant CE, Noble WS. 2015. The MEME Suite. Nucleic Acids Res 43: W39–W49. 10.1093/nar/gkv416
- ↵Bentsen M, Goymann P, Schultheis H, Klee K, Petrova A, Wiegandt R, Fust A, Preussner J, Kuenne C, Braun T, 2020. ATAC-seq footprinting unravels kinetics of transcription factor binding during zygotic genome activation. Nat Commun 11: 4267. 10.1038/s41467-020-18035-1
- ↵Bernstein BE, Kamal M, Lindblad-Toh K, Bekiranov S, Bailey DK, Huebert DJ, McMahon S, Karlsson EK, Kulbokas EJ, Gingeras TR, 2005. Genomic maps and comparative analysis of histone modifications in human and mouse. Cell 120: 169–181. 10.1016/j.cell.2005.01.001
- ↵Berry M, Nunez AM, Chambon P. 1989. Estrogen-responsive element of the human pS2 gene is an imperfectly palindromic sequence. Proc Natl Acad Sci 86: 1218–1222. 10.1073/pnas.86.4.1218
- ↵Carleton JB, Berrett KC, Gertz J. 2017. Multiplex enhancer interference reveals collaborative control of gene regulation by estrogen receptor alpha bound enhancers. Cell Syst 5: 333–344.e5. 10.1016/j.cels.2017.08.011
- ↵Carleton JB, Ginley-Hidinger M, Berrett KC, Layer RM, Quinlan AR, Gertz J. 2020. Regulatory sharing between estrogen receptor α bound enhancers. Nucleic Acids Res 48: 6597–6610. 10.1093/nar/gkaa454
- ↵Carroll JS, Liu XS, Brodsky AS, Li W, Meyer CA, Szary AJ, Eeckhoute J, Shao W, Hestermann EV, Geistlinger TR, 2005. Chromosome-wide mapping of estrogen receptor binding reveals long-range regulation requiring the forkhead protein FoxA1. Cell 122: 33–43. 10.1016/j.cell.2005.05.008
- ↵Carroll JS, Meyer CA, Song J, Li W, Geistlinger TR, Eeckhoute J, Brodsky AS, Keeton EK, Fertuck KC, Hall GF, 2006. Genome-wide analysis of estrogen receptor binding sites. Nat Genet 38: 1289–1297. 10.1038/ng1901
- ↵Chen D, Parker TM, Bhat-Nakshatri P, Chu X, Liu Y, Wang Y, Nakshatri H. 2021. Nonlinear relationship between chromatin accessibility and estradiol-regulated gene expression. Oncogene 40: 1332–1346. 10.1038/s41388-020-01607-2
- ↵Cheng J, Blum R, Bowman C, Hu D, Shilatifard A, Shen S, Dynlacht BD. 2014. A role for H3K4 mono-methylation in gene repression and partitioning of chromatin readers. Mol Cell 53: 979–992. 10.1016/j.molcel.2014.02.032
- ↵Chi D, Singhal H, Li L, Xiao T, Liu W, Pun M, Jeselsohn R, He H, Lim E, Vadhi R, 2019. Estrogen receptor signaling is reprogrammed during breast tumorigenesis. Proc Natl Acad Sci 116: 11437–11443. 10.1073/pnas.1819155116
- ↵Corces MR, Granja JM, Shams S, Louie BH, Seoane JA, Zhou W, Silva TC, Groeneveld C, Wong CK, Cho SW, 2018. The chromatin accessibility landscape of primary human cancers. Science 362: eaav1898. 10.1126/science.aav1898
- ↵Danecek P, Bonfield JK, Liddle J, Marshall J, Ohan V, Pollard MO, Whitwham A, Keane T, McCarthy SA, Davies RM, 2021. Twelve years of SAMtools and BCFtools. GigaScience 10: giab008. 10.1093/gigascience/giab008
- ↵Ernst J, Kellis M. 2017. Chromatin state discovery and genome annotation with ChromHMM. Nat Protoc 12: 2478–2492. 10.1038/nprot.2017.124
- ↵Franco HL, Nagari A, Kraus WL. 2015. TNFα signaling exposes latent estrogen receptor binding sites to alter the breast cancer cell transcriptome. Mol Cell 58: 21–34. 10.1016/j.molcel.2015.02.001
- ↵Franco HL, Nagari A, Malladi VS, Li W, Xi Y, Richardson D, Allton KL, Tanaka K, Li J, Murakami S, 2018. Enhancer transcription reveals subtype-specific gene expression programs controlling breast cancer pathogenesis. Genome Res 28: 159–170. 10.1101/gr.226019.117
- ↵Fullwood MJ, Liu MH, Pan YF, Liu J, Xu H, Mohamed YB, Orlov YL, Velkov S, Ho A, Mei PH, 2009. An oestrogen-receptor-alpha-bound human chromatin interactome. Nature 462: 58–64. 10.1038/nature08497
- ↵Gertz J, Savic D, Varley KE, Partridge EC, Safi A, Jain P, Cooper GM, Reddy TE, Crawford GE, Myers RM. 2013. Distinct properties of cell-type-specific and shared transcription factor binding sites. Mol Cell 52: 25–36. 10.1016/j.molcel.2013.08.037
- ↵Guan J, Zhou W, Hafner M, Blake RA, Chalouni C, Chen IP, De Bruyn T, Giltnane JM, Hartman SJ, Heidersbach A, 2019. Therapeutic ligands antagonize estrogen receptor function by impairing its mobility. Cell 178: 949–963.e18. 10.1016/j.cell.2019.06.026
- ↵Guertin MJ, Zhang X, Coonrod SA, Hager GL. 2014. Transient estrogen receptor binding and p300 redistribution support a squelching mechanism for estradiol-repressed genes. Mol Endocrinol 28: 1522–1533. 10.1210/me.2014-1130
- ↵Haeussler M, Zweig AS, Tyner C, Speir ML, Rosenbloom KR, Raney BJ, Lee CM, Lee BT, Hinrichs AS, Gonzalez JN, 2019. The UCSC Genome Browser database: 2019 update. Nucleic Acids Res 47: D853–D858. 10.1093/nar/gky1095
- ↵Hah N, Danko CG, Core L, Waterfall JJ, Siepel A, Lis JT, Kraus WL. 2011. A rapid, extensive, and transient transcriptional response to estrogen signaling in breast cancer cells. Cell 145: 622–634. 10.1016/j.cell.2011.03.042
- ↵Hall JM, McDonnell DP, Korach KS. 2002. Allosteric regulation of estrogen receptor structure, function, and coactivator recruitment by different estrogen response elements. Mol Endocrinol 16: 469–486. 10.1210/mend.16.3.0814
- ↵Hammal F, de Langen P, Bergon A, Lopez F, Ballester B. 2022. ReMap 2022: a database of human, mouse, Drosophila and Arabidopsis regulatory regions from an integrative analysis of DNA-binding sequencing experiments. Nucleic Acids Res 50: D316–D325. 10.1093/nar/gkab996
- ↵Hanstein B, Eckner R, DiRenzo J, Halachmi S, Liu H, Searcy B, Kurokawa R, Brown M. 1996. P300 is a component of an estrogen receptor coactivator complex. Proc Natl Acad Sci 93: 11540–11545. 10.1073/pnas.93.21.11540
- ↵He H, Sinha I, Fan R, Haldosen L-A, Yan F, Zhao C, Dahlman-Wright K. 2018. c-Jun/AP-1 overexpression reprograms ERα signaling related to tamoxifen response in ERα-positive breast cancer. Oncogene 37: 2586–2600. 10.1038/s41388-018-0165-8
- ↵Heintzman ND, Stuart RK, Hon G, Fu Y, Ching CW, Hawkins RD, Barrera LO, Van Calcar S, Qu C, Ching KA, 2007. Distinct and predictive chromatin signatures of transcriptional promoters and enhancers in the human genome. Nat Genet 39: 311–318. 10.1038/ng1966
- ↵Heldring N, Isaacs GD, Diehl AG, Sun M, Cheung E, Ranish JA, Kraus WL. 2011. Multiple sequence-specific DNA-binding proteins mediate estrogen receptor signaling through a tethering pathway. Mol Endocrinol 25: 564–574. 10.1210/me.2010-0425
- ↵Honkela A, Peltonen J, Topa H, Charapitsa I, Matarese F, Grote K, Stunnenberg HG, Reid G, Lawrence ND, Rattray M. 2015. Genome-wide modeling of transcription kinetics reveals patterns of RNA production delays. Proc Natl Acad Sci 112: 13115–13120. 10.1073/pnas.1420404112
- ↵Hsu P-Y, Hsu H-K, Singer GAC, Yan PS, Rodriguez BAT, Liu JC, Weng Y-I, Deatherage DE, Chen Z, Pereira JS, 2010. Estrogen-mediated epigenetic repression of large chromosomal regions through DNA looping. Genome Res 20: 733–744. 10.1101/gr.101923.109
- ↵Huang C-CF, Lingadahalli S, Morova T, Ozturan D, Hu E, Yu IPL, Linder S, Hoogstraat M, Stelloo S, Sar F, 2021. Functional mapping of androgen receptor enhancer activity. Genome Biol 22: 149. 10.1186/s13059-021-02339-6
- ↵Hurtado A, Holmes KA, Ross-Innes CS, Schmidt D, Carroll JS. 2011. FOXA1 is a key determinant of estrogen receptor function and endocrine response. Nat Genet 43: 27–33. 10.1038/ng.730
- ↵Jansen MPHM, Knijnenburg T, Reijm EA, Simon I, Kerkhoven R, Droog M, Velds A, van Laere S, Dirix L, Alexi X, 2013. Hallmarks of aromatase inhibitor drug resistance revealed by epigenetic profiling in breast cancer. Cancer Res 73: 6632–6641. 10.1158/0008-5472.CAN-13-0704
- ↵Johnson TA, Chereji RV, Stavreva DA, Morris SA, Hager GL, Clark DJ. 2018. Conventional and pioneer modes of glucocorticoid receptor interaction with enhancer chromatin in vivo. Nucleic Acids Res 46: 203–214. 10.1093/nar/gkx1044
- ↵Joosten SEP, Gregoricchio S, Stelloo S, Yapıcı E, Huang C-CF, Yavuz K, Donaldson Collier M, Morova T, Altintaş UB, Kim Y, 2024. Estrogen receptor 1 chromatin profiling in human breast tumors reveals high inter-patient heterogeneity with enrichment of risk SNPs and enhancer activity at most-conserved regions. Genome Res 34: 539–555. 10.1101/gr.278680.123
- ↵Kang YK, Guermah M, Yuan C-X, Roeder RG. 2002. The TRAP/Mediator coactivator complex interacts directly with estrogen receptors α and β through the TRAP220 subunit and directly enhances estrogen receptor function in vitro. Proc Natl Acad Sci 99: 2642–2647. 10.1073/pnas.261715899
- ↵Klinge CM. 2001. Estrogen receptor interaction with estrogen response elements. Nucleic Acids Res 29: 2905–2919. 10.1093/nar/29.14.2905
- ↵Kuilman T, Velds A, Kemper K, Ranzani M, Bombardelli L, Hoogstraat M, Nevedomskaya E, Xu G, de Ruiter J, Lolkema MP, 2015. CopywriteR: DNA copy number detection from off-target sequence data. Genome Biol 16: 49. 10.1186/s13059-015-0617-1
- ↵Kumaran M, Cass CE, Graham K, Mackey JR, Hubaux R, Lam W, Yasui Y, Damaraju S. 2017. Germline copy number variations are associated with breast cancer risk and prognosis. Sci Rep 7: 14621. 10.1038/s41598-017-14799-7
- ↵Latham JA, Dent SYR. 2007. Cross-regulation of histone modifications. Nat Struct Mol Biol 14: 1017–1024. 10.1038/nsmb1307
- ↵Lawrence M, Huber W, Pagès H, Aboyoun P, Carlson M, Gentleman R, Morgan MT, Carey VJ. 2013. Software for computing and annotating genomic ranges. PLoS Comput Biol 9: e1003118. 10.1371/journal.pcbi.1003118
- ↵Li H, Durbin R. 2009. Fast and accurate short read alignment with Burrows–Wheeler transform. Bioinformatics 25: 1754–1760. 10.1093/bioinformatics/btp324
- ↵Liberzon A, Birger C, Thorvaldsdóttir H, Ghandi M, Mesirov JP, Tamayo P. 2015. The Molecular Signatures Database (MSigDB) hallmark gene set collection. Cell Syst 1: 417–425. 10.1016/j.cels.2015.12.004
- ↵Linder S, Hoogstraat M, Stelloo S, Eickhoff N, Schuurman K, de Barros H, Alkemade M, Bekers EM, Severson TM, Sanders J, 2022. Drug-induced epigenomic plasticity reprograms circadian rhythm regulation to drive prostate cancer toward androgen independence. Cancer Discov 12: 2074–2097. 10.1158/2159-8290.CD-21-0576
- ↵Love MI, Huber W, Anders S. 2014. Moderated estimation of fold change and dispersion for RNA-seq data with DESeq2. Genome Biol 15: 550. 10.1186/s13059-014-0550-8
- ↵Mazrooei P, Kron KJ, Zhu Y, Zhou S, Grillo G, Mehdi T, Ahmed M, Severson TM, Guilhamon P, Armstrong NS, 2019. Cistrome partitioning reveals convergence of somatic mutations and risk variants on master transcription regulators in primary prostate tumors. Cancer Cell 36: 674–689.e6. 10.1016/j.ccell.2019.10.005
- ↵Meijsing SH, Pufall MA, So AY, Bates DL, Chen L, Yamamoto KR. 2009. DNA binding site sequence directs glucocorticoid receptor structure and activity. Science 324: 407–410. 10.1126/science.1164265
- ↵Miranda TB, Voss TC, Sung M-H, Baek S, John S, Hawkins M, Grøntved L, Schiltz RL, Hager GL. 2013. Reprogramming the chromatin landscape: interplay of the estrogen and glucocorticoid receptors at the genomic level. Cancer Res 73: 5130–5139. 10.1158/0008-5472.CAN-13-0742
- ↵Mladenova V, Mladenov E, Russev G. 2009. Organization of plasmid DNA into nucleosome-like structures after transfection in eukaryotic cells. Biotechnol Biotechnol Equip 23: 1044–1047. 10.1080/13102818.2009.10817609
- ↵Murakami S, Nagari A, Kraus WL. 2017. Dynamic assembly and activation of estrogen receptor α enhancers through coregulator switching. Genes Dev 31: 1535–1548. 10.1101/gad.302182.117
- ↵Nawaz Z, Lonard DM, Dennis AP, Smith CL, O'Malley BW. 1999. Proteasome-dependent degradation of the human estrogen receptor. Proc Natl Acad Sci 96: 1858–1862. 10.1073/pnas.96.5.1858
- ↵Paakinaho V, Swinstead EE, Presman DM, Grøntved L, Hager GL. 2019. Meta-analysis of chromatin programming by steroid receptors. Cell Rep 28: 3523–3534.e2. 10.1016/j.celrep.2019.08.039
- ↵Parker JS, Mullins M, Cheang MCU, Leung S, Voduc D, Vickery T, Davies S, Fauron C, He X, Hu Z, 2009. Supervised risk predictor of breast cancer based on intrinsic subtypes. J Clin Oncol 27: 1160–1167. 10.1200/JCO.2008.18.1370
- ↵Pekowska A, Benoukraf T, Zacarias-Cabeza J, Belhocine M, Koch F, Holota H, Imbert J, Andrau J-C, Ferrier P, Spicuglia S. 2011. H3k4 tri-methylation provides an epigenetic signature of active enhancers. EMBO J 30: 4198–4210. 10.1038/emboj.2011.295
- ↵Perou CM, Sørlie T, Eisen MB, van de Rijn M, Jeffrey SS, Rees CA, Pollack JR, Ross DT, Johnsen H, Akslen LA, 2000. Molecular portraits of human breast tumours. Nature 406: 747–752. 10.1038/35021093
- ↵Piryaei Z, Salehi Z, Tahsili MR, Ebrahimie E, Ebrahimi M, Kavousi K. 2022. Agonist/antagonist compounds’ mechanism of action on estrogen receptor-positive breast cancer: a system-level investigation assisted by meta-analysis. Inf Med Unlocked 31: 100985. 10.1016/j.imu.2022.100985
- ↵Piryaei Z, Salehi Z, Ebrahimie E, Ebrahimi M, Kavousi K. 2023. Meta-analysis of integrated ChIP-seq and transcriptome data revealed genomic regions affected by estrogen receptor alpha in breast cancer. BMC Med Genomics 16: 219. 10.1186/s12920-023-01655-z
- ↵Pomerantz MM, Li F, Takeda DY, Lenci R, Chonkar A, Chabot M, Cejas P, Vazquez F, Cook J, Shivdasani RA, 2015. The androgen receptor cistrome is extensively reprogrammed in human prostate tumorigenesis. Nat Genet 47: 1346–1351. 10.1038/ng.3419
- ↵Pomerantz MM, Qiu X, Zhu Y, Takeda DY, Pan W, Baca SC, Gusev A, Korthauer KD, Severson TM, Ha G, 2020. Prostate cancer reactivates developmental epigenomic programs during metastatic progression. Nat Genet 52: 790–799. 10.1038/s41588-020-0664-8
- ↵Quinlan AR. 2014. BEDTools: the Swiss-army tool for genome feature analysis. Curr Protoc Bioinformatics 47: 11.12.1–11.12.34. 10.1002/0471250953.bi1112s47
- ↵R Core Team. 2021. R: a language and environment for statistical computing. R Foundation for Statistical Computing, Vienna. https://www.R-project.org/.
- ↵Rosell M, Nevedomskaya E, Stelloo S, Nautiyal J, Poliandri A, Steel JH, Wessels LFA, Carroll JS, Parker MG, Zwart W. 2014. Complex formation and function of estrogen receptor α in transcription requires RIP140. Cancer Res 74: 5469–5479. 10.1158/0008-5472.CAN-13-3429
- ↵Ross-Innes CS, Stark R, Teschendorff AE, Holmes KA, Ali HR, Dunning MJ, Brown GD, Gojis O, Ellis IO, Green AR, 2012. Differential oestrogen receptor binding is associated with clinical outcome in breast cancer. Nature 481: 389–393. 10.1038/nature10730
- ↵Saravanan B, Soota D, Islam Z, Majumdar S, Mann R, Meel S, Farooq U, Walavalkar K, Gayen S, Singh AK, 2020. Ligand dependent gene regulation by transient ERα clustered enhancers. PLoS Genet 16: e1008516. 10.1371/journal.pgen.1008516
- ↵Severson TM, Nevedomskaya E, Peeters J, Kuilman T, Krijgsman O, van Rossum A, Droog M, Kim Y, Koornstra R, Beumer I, 2016. Neoadjuvant tamoxifen synchronizes ERα binding and gene expression profiles related to outcome and proliferation. Oncotarget 7: 33901–33918. 10.18632/oncotarget.8983
- ↵Severson TM, Kim Y, Joosten SEP, Schuurman K, van der Groep P, Moelans CB, Ter Hoeve ND, Manson QF, Martens JW, van Deurzen CHM, 2018. Characterizing steroid hormone receptor chromatin binding landscapes in male and female breast cancer. Nat Commun 9: 482. 10.1038/s41467-018-02856-2
- ↵Severson TM, Zhu Y, De Marzo AM, Jones T, Simons JW, Nelson WG, Yegnasubramanian S, Freedman ML, Wessels L, Bergman AM, 2021. Epigenetic and transcriptional analysis reveals a core transcriptional program conserved in clonal prostate cancer metastases. Mol Oncol 15: 1942–1955. 10.1002/1878-0261.12923
- ↵Shang Y, Hu X, DiRenzo J, Lazar MA, Brown M. 2000. Cofactor dynamics and sufficiency in estrogen receptor–regulated transcription. Cell 103: 843–852. 10.1016/S0092-8674(00)00188-4
- ↵Stelloo S, Nevedomskaya E, van der Poel HG, de Jong J, van Leenders GJ, Jenster G, Wessels LF, Bergman AM, Zwart W. 2015. Androgen receptor profiling predicts prostate cancer outcome. EMBO Mol Med 7: 1450–1464. 10.15252/emmm.201505424
- ↵Stender JD, Kim K, Charn TH, Komm B, Chang KCN, Kraus WL, Benner C, Glass CK, Katzenellenbogen BS. 2010. Genome-wide analysis of estrogen receptor α DNA binding and tethering mechanisms identifies Runx1 as a novel tethering factor in receptor-mediated transcriptional activation. Mol Cell Biol 30: 3943–3955. 10.1128/MCB.00118-10
- ↵Taing L, Dandawate A, L'Yi S, Gehlenborg N, Brown M, Meyer CA. 2024. Cistrome Data Browser: integrated search, analysis and visualization of chromatin data. Nucleic Acids Res 52: D61–D66. 10.1093/nar/gkad1069
- ↵Vockley CM, D'Ippolito AM, McDowell IC, Majoros WH, Safi A, Song L, Crawford GE, Reddy TE. 2016. Direct GR binding sites potentiate clusters of TF binding across the human genome. Cell 166: 1269–1281.e19. 10.1016/j.cell.2016.07.049
- ↵Wang J, Zhao Y, Zhou X, Hiebert SW, Liu Q, Shyr Y. 2018. Nascent RNA sequencing analysis provides insights into enhancer-mediated gene regulation. BMC Genomics 19: 633. 10.1186/s12864-018-5016-z
- ↵Wilcox N, Dumont M, González-Neira A, Carvalho S, Joly Beauparlant C, Crotti M, Luccarini C, Soucy P, Dubois S, Nuñez-Torres R, 2023. Exome sequencing identifies breast cancer susceptibility genes and defines the contribution of coding variants to breast cancer risk. Nat Genet 55: 1435–1439. 10.1038/s41588-023-01466-z
- ↵Wu T, Hu E, Xu S, Chen M, Guo P, Dai Z, Feng T, Zhou L, Tang W, Zhan L, 2021. ClusterProfiler 4.0: a universal enrichment tool for interpreting omics data. Innovation (Camb) 2: 100141. 10.1016/j.xinn.2021.100141
- ↵Xi Y, Shi J, Li W, Tanaka K, Allton KL, Richardson D, Li J, Franco HL, Nagari A, Malladi VS, 2018. Histone modification profiling in breast cancer cell lines highlights commonalities and differences among subtypes. BMC Genomics 19: 150. 10.1186/s12864-018-4533-0
- ↵Yi P, Wang Z, Feng Q, Pintilie GD, Foulds CE, Lanz RB, Ludtke SJ, Schmid MF, Chiu W, O'Malley BW. 2015. Structure of a biologically active estrogen receptor-coactivator complex on DNA. Mol Cell 57: 1047–1058. 10.1016/j.molcel.2015.01.025
- ↵Yi P, Wang Z, Feng Q, Chou C-K, Pintilie GD, Shen H, Foulds CE, Fan G, Serysheva I, Ludtke SJ, 2017. Structural and functional impacts of ER coactivator sequential recruitment. Mol Cell 67: 733–743.e4. 10.1016/j.molcel.2017.07.026
- ↵Yu G, Wang L-G, He Q-Y. 2015. ChIPseeker: an R/Bioconductor package for ChIP peak annotation, comparison and visualization. Bioinformatics 31: 2382–2383. 10.1093/bioinformatics/btv145
- ↵Zhao Z, Shilatifard A. 2019. Epigenetic modifications of histones in cancer. Genome Biol 20: 245. 10.1186/s13059-019-1870-5
- ↵Zhu Y, Sun L, Chen Z, Whitaker JW, Wang T, Wang W. 2013. Predicting enhancer transcription and activity from chromatin modifications. Nucleic Acids Res 41: 10032–10043. 10.1093/nar/gkt826
- ↵Zwart W, Theodorou V, Kok M, Canisius S, Linn S, Carroll JS. 2011. Oestrogen receptor–co-factor–chromatin specificity in the transcriptional regulation of breast cancer. EMBO J 30: 4764–4776. 10.1038/emboj.2011.368