Abstract
Recombination is a key molecular mechanism that has profound implications on both micro- and macroevolutionary processes. However, the determinants of recombination rate variation in holocentric organisms are poorly understood, in particular in Lepidoptera (moths and butterflies). The wood white butterfly (Leptidea sinapis) shows considerable intraspecific variation in chromosome numbers and is a suitable system for studying regional recombination rate variation and its potential molecular underpinnings. Here, we developed a large whole-genome resequencing data set from a population of wood whites to obtain high-resolution recombination maps using linkage disequilibrium information. The analyses revealed that larger chromosomes had a bimodal recombination landscape, potentially caused by interference between simultaneous chiasmata. The recombination rate was significantly lower in subtelomeric regions, with exceptions associated with segregating chromosome rearrangements, showing that fissions and fusions can have considerable effects on the recombination landscape. There was no association between the inferred recombination rate and base composition, supporting a limited influence of GC-biased gene conversion in butterflies. We found significant but variable associations between the recombination rate and the density of different classes of transposable elements, most notably a significant enrichment of short interspersed nucleotide elements in genomic regions with higher recombination rate. Finally, the analyses unveiled significant enrichment of genes involved in farnesyltranstransferase activity in recombination coldspots, potentially indicating that expression of transferases can inhibit formation of chiasmata during meiotic division. Our results provide novel information about recombination rate variation in holocentric organisms and have particular implications for forthcoming research in population genetics, molecular/genome evolution, and speciation.
Meiotic division allows sexually reproducing organisms to generate haploid gametes. During meiosis, double-strand breaks are induced into DNA, and a proportion (e.g., 5% in Arabidopsis thaliana, 10% in Mus musculus) of those are resolved as crossovers (Moens et al. 2002; Choi and Henderson 2015), leading to novel combinations of chromosome segments. The frequency and distribution of crossovers can influence both micro- and macroevolutionary processes. Hence, detailed knowledge about the recombination landscape is essential for understanding the relative importance of different mechanisms affecting genome evolution, maintenance of genetic diversity, adaptation, and speciation (Dapper and Payseur 2017; Stapley et al. 2017; Peñalba and Wolf 2020).
The frequency of recombination events resolved as crossovers (from here on recombination) can vary both between (Smukowski and Noor 2011; Stapley et al. 2017) and within species (Johnston et al. 2016; Samuk et al. 2020) and over time (Stapley et al. 2017; Peñalba and Wolf 2020). Recombination has a genetic component, but is also influenced by environmental factors (i.e., recombination is partly plastic; Peñalba and Wolf 2020). Recombination rate usually varies considerably across chromosomes and genomic regions, and mapping this variation may shed light on the mechanistic control of where recombination is initiated. The reasons for such regional recombination rate variation have been studied in detail in a few organism groups and a handful of consensuses have been reached. First, the size of a chromosome can affect the recombination rate, as correct segregation seems to be dependent on at least one recombination event per chromosome arm (Pardo-Manuel de Villena and Sapienza 2001; Smith and Nambiar 2020). A lower recombination rate on the sex chromosomes than on the autosomes is also a commonly observed pattern, which can be attributed to low sequence homology caused by the degeneration of sex-limited chromosomes (Y or W) (e.g., Bergero and Charlesworth 2009). Within chromosomes, the location of recombination events might be determined by preferential initiation of double-strand breaks close to the telomeres and where the chromatin is open and accessible (e.g., Gray and Cohen 2016; Haenel et al. 2018). Conversely, recombination is usually suppressed within and around the highly heterochromatic centromeres (Dapper and Payseur 2017; Stapley et al. 2017). Furthermore, physical interference between multiple chiasmata may lead to regional differences in recombination rate (Gray and Cohen 2016; Peñalba and Wolf 2020). The zinc-finger protein encoded by the gene PRDM9 has been described as an important regulator of recombination in some species. This protein recognizes specific sequence motifs where histone H3 trimethylation is induced, which explains that most recombination events occur in a limited portion of the genome, that is, recombination hotspots (e.g., Myers et al. 2005; Grey et al. 2011). The gene PRDM9 is found in several vertebrate and invertebrate species (Oliver et al. 2009), but partial or complete gene loss has been common across the Metazoan tree of life (Baker et al. 2017). In organisms lacking a functional copy of PRDM9, the initiation of crossovers and the distribution of recombination across the genome must be mediated by other factors.
We expect the regional variation in recombination rate to be associated with genomic features, the efficiency of selection, and the levels of genetic diversity (Dolgin and Charlesworth 2008; Petrov et al. 2011). Regional variation in the efficiency of selection can affect the distribution of transposable elements (TEs), which tend to accumulate in regions of low recombination rate (Bartolomé et al. 2002; Xu and Du 2014). The frequency of recombination events can also directly affect nucleotide composition through GC-biased gene conversion (gBGC), a process that facilitates the fixation of strong (G and C) over weak nucleotides (A and T) during the double-strand break repair step (Duret and Galtier 2009). In addition to the effect of recombination-mediated gBGC on nucleotide composition, we expect regional variation in recombination to affect the patterns of genetic diversity. Specifically, a lower recombination rate is expected to lead to reduced genetic variation via background selection (loss of neutral variants linked to deleterious mutations during purifying selection) (Charlesworth 1994; Comeron 2017) and selective sweeps/hitch-hiking (haplotypes around advantageous mutations increase in frequency or get fixed) (Maynard Smith and Haigh 1974; Cutter and Payseur 2013). Although genome-wide estimates of recombination rate and large-scale variation have been characterized for many species, detailed recombination maps are still mainly limited to model organisms and domesticated species, although little is known for natural populations. A broader taxonomic sampling is hence necessary to get a more complete picture of what drives recombination rate variation within genomes and between lineages. This applies not the least to holocentric organisms without localized centromeres (Suomalainen 1953), such as Lepidoptera, in which the research on causes and consequences of recombination rate variation is still in its infancy.
Here, we used a large, whole-genome resequencing data set from a Swedish population of the wood white butterfly (Leptidea sinapis) to characterize the fine-scale variation in recombination rate and assess its potential associations with nucleotide composition and genomic features. So far, knowledge about recombination rate variation in Lepidoptera is restricted to a handful of pedigree-based genetic maps (Davey et al. 2017; Shipilina et al. 2022; Smolander et al. 2022) and this is therefore a spearheading attempt to describe the fine-scale variation in recombination rate in a butterfly. The wood white is widely distributed across western Eurasia and shows extreme variation in chromosome numbers, with a cline-like pattern increasing from 2n∼56–60 in the northern (Scandinavia) and eastern (central Asia) parts of the distribution to 2n∼106–110 in the southwestern (Iberia) end (Dincă et al. 2011; Lukhtanov et al. 2018). Hence, some populations differ significantly from the ancestral Lepidoptera chromosome number of n = 31 (Robinson 1971; Ahola et al. 2014). Previous studies suggest that recurrent chromosome fissions and fusions underlie this variation (Dincă et al. 2011; Talla et al. 2017) and that a handful of fusion/fission polymorphisms segregate in the Swedish population (Höök et al. 2023). The rapid karyotype evolution in wood whites provides a unique system for characterizing the regional variation in recombination rate in a natural population of a holocentric species and investigating the effects of segregating chromosome rearrangements. Given the key role of recombination in both micro- and macroevolutionary processes, our results will be important for understanding molecular mechanisms and evolutionary forces affecting genome evolution and divergence in holocentric organisms.
Results
84 Leptidea sinapis males were sampled across Sweden and used for paired-end Illumina sequencing. Chromosome-specific demographic histories were inferred with SMC++ (Terhorst et al. 2017) using six “distinguished” individuals, selected to represent the entire geographical distribution. The per base, per generation recombination rate was inferred with pyrho (Spence and Song 2019), using the demographic trajectories together with patterns of linkage disequilibrium (LD) between single-nucleotide polymorphisms (SNPs). We characterized recombination hotspots and coldspots and investigated potential associations between recombination and genomic features to understand the mechanistic underpinnings and evolutionary consequences of recombination rate variation.
Demographic history inferences
The demographic trajectories, inferred separately for each chromosome, jointly revealed the demographic history of the Swedish L. sinapis population. These trajectories shared three main features: firstly, a maximum effective population size (Ne) of ≈106 approximately 10,000 generations before present (BP), preceded by a slight increase matching with the end of the Last Glacial Period (LGP). More recently, Ne gradually declined until stabilizing about 100 generations BP. Contemporary estimates of Ne oscillate between 103 and 2.5 × 10⁴ for the different chromosomes (Fig. 1).
Demographic trajectories inferred for the different chromosomes in the Swedish population of the wood white. Six out of the ten individuals with the highest sequencing coverage were used to represent the entire geographic distribution. Only the 100,000 most-recent generations of the trajectories are shown, as all useful variation in Ne happens within that range. The number of generations is equivalent to the identical number of years only if we assume univoltinity over time. The black line indicates the mean Ne across chromosomes.
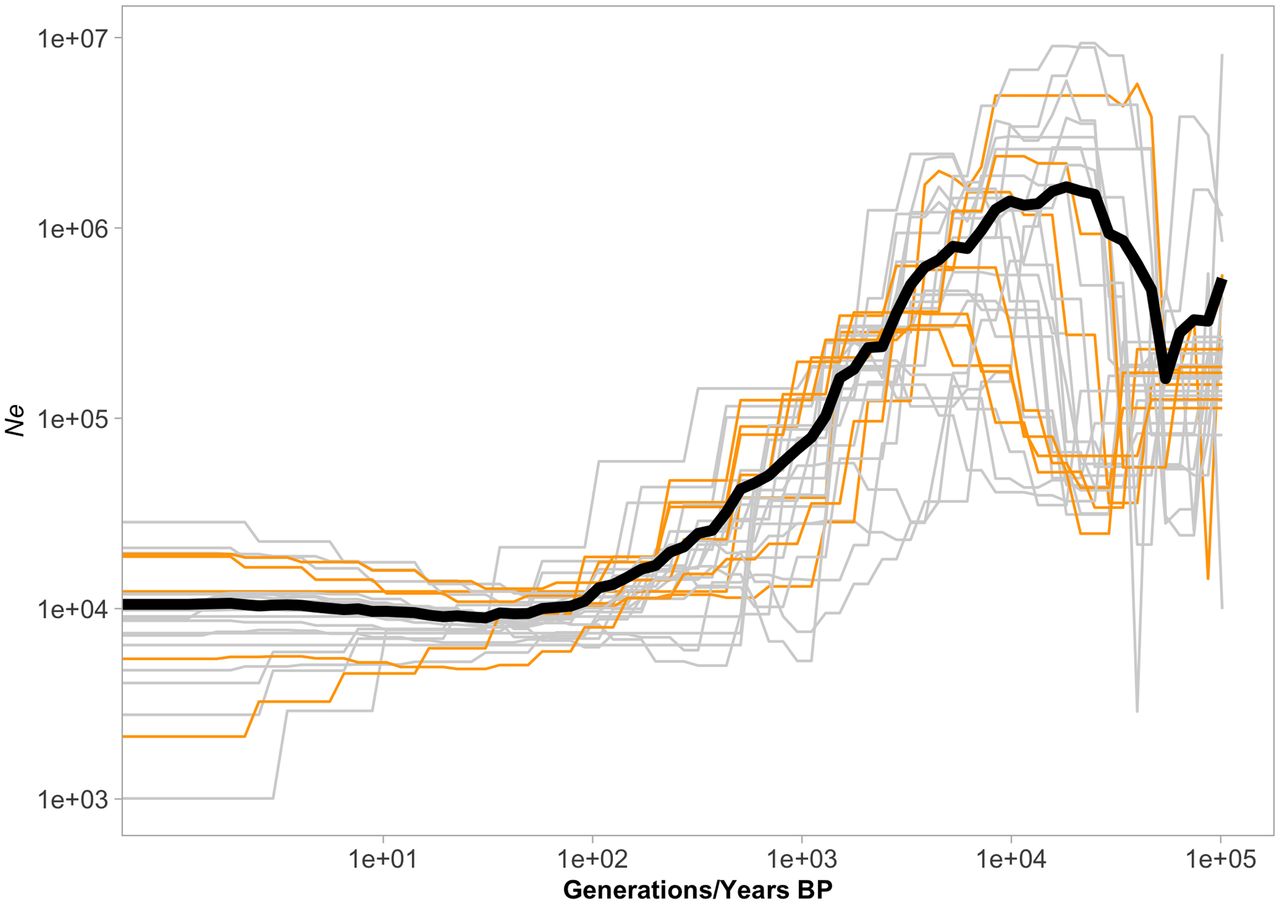
To test for consistency in the demographic inference, the analyses were repeated using another six randomly selected distinguished individuals. There was no significant difference in Ne (mean difference = 1618 across chromosomes) between the two analyses (Wilcoxon's test, V = 242, P = 0.38), indicating that the selection of distinguished individuals has a minor effect on the inferred demographic trajectories.
Recombination rate variation and distribution
The genome-wide recombination rate was 7.37 cM/Mb, with individual chromosomes ranging between 3.5 and 15.3 cM/Mb. There was a trend toward lower recombination rates on larger chromosomes, but it was not significant (Spearman's rho = −0.292, P = 0.06; Supplemental Fig. 1). Also, the recombination rates on autosomes (7.65 cM/Mb) and Z Chromosomes (7.03 cM/Mb) were not significantly different (Wilcoxon's test, W = 41, P = 0.92).
Visual inspection of the recombination maps revealed a considerably reduced rate toward chromosome ends (Fig. 2A). A formal analysis showed that the recombination rate in the subtelomeric regions (five 100-kb windows at each chromosome end, respectively) was significantly reduced (2.46 cM/Mb) compared to proximal chromosome regions, that is, outside of the subtelomeric regions (Wilcoxon's test, W = 1,310,856, P-value = 3.18 × 10−66). This, however, does not necessarily reflect a low recombination rate in the telomeres per se, because these were not covered in the wood white genome assembly (Höök et al. 2023). We found a significant reduction in recombination rate in 50 out of the 58 subtelomeric regions (29 chromosome pairs, 2n = 58; Supplemental Table 1). Four out of the eight chromosome ends with no significant reduction in recombination rate match observations of segregating fusion/fission polymorphisms; these involve chromosome pairs 18 and 25, 11 and 26, and 5 and 27 (Höök et al. 2023).
Recombination rate estimates and hotspot characterization. (A) Estimates of the recombination rate (cM/Mb) in 1-Mb windows, chromosomes ordered by chromosome length. (B) As an example, we show a detailed recombination map for Chromosome 24. The inferred regional recombination rate is represented by gray bars and the orange line represents the threshold for calling recombination hotspots, equivalent to 10× the background recombination rate for a given interval. Red lines underneath the plot indicate the positions of inferred recombination hotspots.
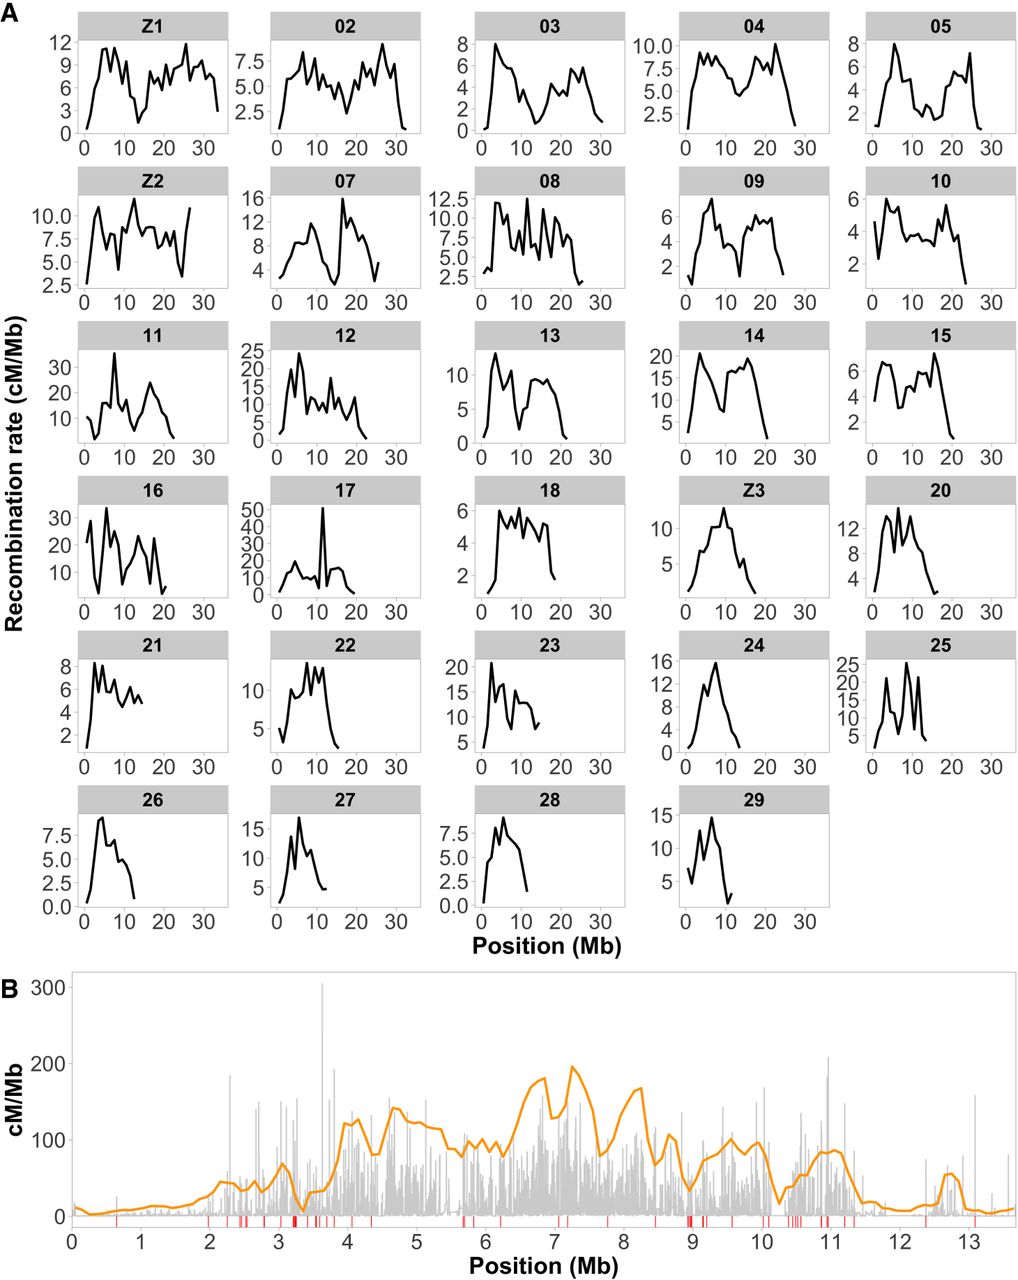
Besides the reduced recombination rate in subtelomeric regions, we found other differences in regional variation between chromosomes. First, some chromosomes showed a unimodal recombination rate distribution, with higher values in central regions and a progressive decrease toward the ends. This was a frequent (but not exclusive) pattern in shorter chromosomes (<20 Mb, Fig. 2A). In contrast, the recombination landscape was bimodal along most longer chromosomes (>20 Mb, Fig. 2A), with a central region of reduced recombination in addition to the reduction in subtelomeric regions.
Recombination hotspot and coldspot identification
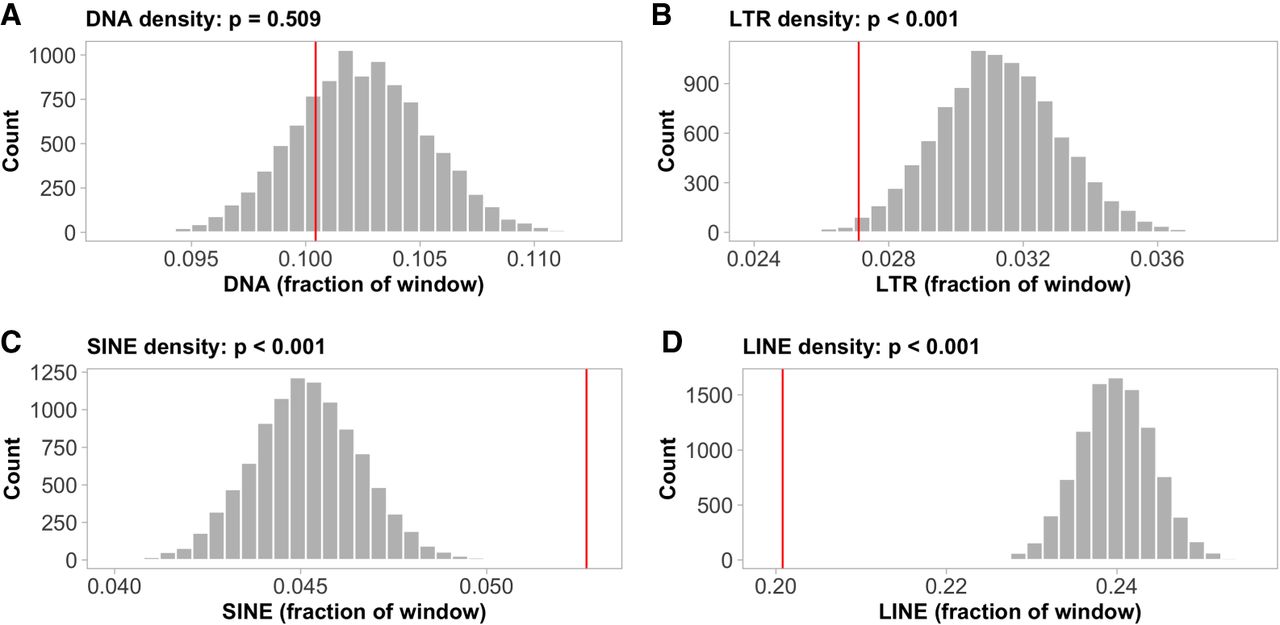
Informed by coalescent simulations, we developed thresholds for the identification of recombination hotspots and coldspots, taking into account the population's demographic history and the potential stochasticity of our method of recombination rate inference (see Methods for further details). Based on these thresholds, 3124 recombination hotspots were classified (Fig. 2B). These were on average 1656 bp long, with a mean recombination rate of 94.1 ± 62.5 cM/Mb (i.e., an ∼13-fold increase over the genome-wide estimate) and a maximum rate of 708 cM/Mb. This translates to 10.7% of historical recombination events in the population occurring within recombination hotspots, despite them constituting only 0.87% (5.2 Mb) of the genome. Recombination hotspots were found at a significantly lower frequency in the terminal 10% regions of the chromosomes (5% on each end; Wilcoxon's W = 220.5; P = 4.94 × 10⁻⁴; Supplemental Fig. 2A). Permutation analysis revealed significantly lower long terminal repeats (LTRs) (P < 0.001, Fig. 3B) and LINE densities (P < 0.001, Fig. 3D), and a higher short-interspersed nucleotide element (SINE) density (P < 0.001, Fig. 3C) in the hotspots, although DNA transposon density did not deviate significantly (P = 0.51, Fig. 3A) from the genome wide average. No functional gene categories or specific sequence motifs were significantly enriched in hotspots (P > 0.05, Supplemental Table 2).
Occurrence of transposable elements (TEs) in hotspots. The histograms show the density distributions of (A) DNA, (B) LTR, (C) SINE, (D) LINE, for 3124 randomly sampled 1656-bp genomic windows (number of, and average length of identified hotspots). The red lines indicate the observed mean TE densities in the defined hotspot regions.
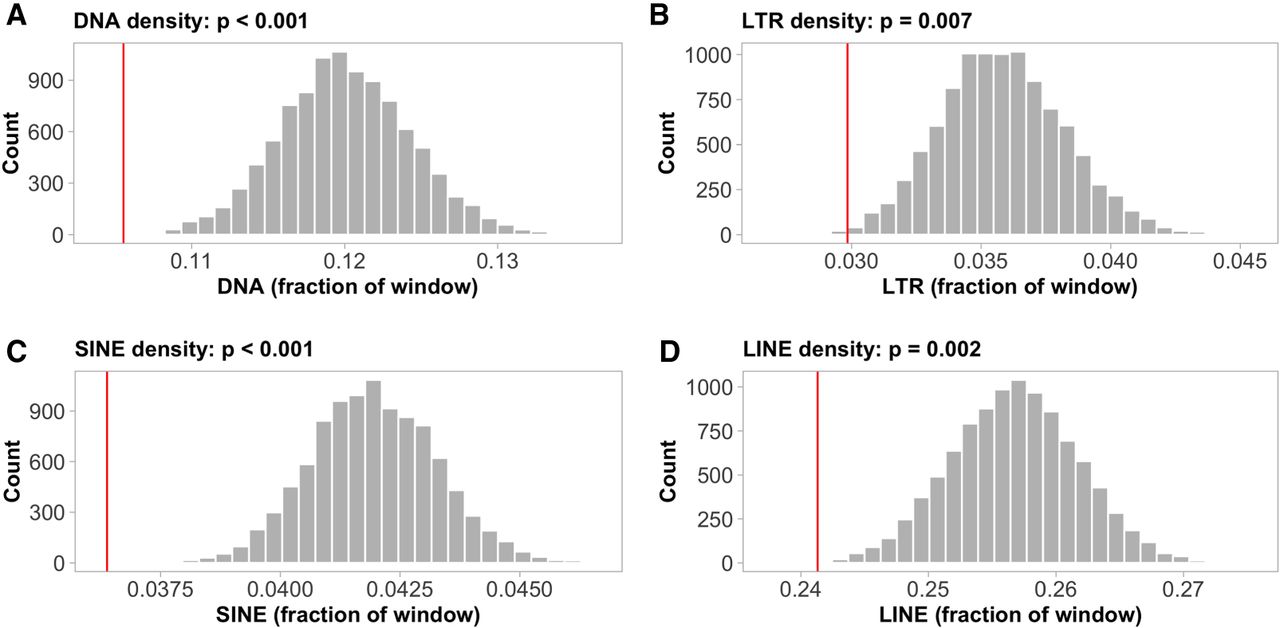
We also identified 1283 recombination coldspots, that is, regions with considerably reduced recombination rate as compared to the genomic average (see Methods). The average length of the coldspots was 30 kb, with 70 of them being longer than 100 kb. Despite the lower frequency of coldspots than hotspots, they represented a larger proportion of the genome (38.2 Mb, 6.37%). As expected, given the reduced recombination rate in subtelomeric regions, coldspots were particularly abundant in these regions. Specifically, subtelomeres contained 29.6% of the coldspots, although representing only 4.8% of the genome. This translates to a significant enrichment of coldspots in the 10% most terminal chromosomal regions compared to the proximal regions (Wilcoxon's W = 3; P = 5.62 × 10⁻⁴; Supplemental Fig. 2B). Permutation analyses revealed a significantly lower transposon density in coldspots, consistent across all classes (P-values < 0.01; Fig. 4A–D). Coldspots also showed a significant enrichment of genes related to transtransferase activity (P-values < 0.01, Supplemental Table 3), but no enrichment of specific sequence motifs (P > 0.05).
Occurrence of transposable elements (TEs) in coldspots. The histograms show the density distributions of (A) DNA, (B) LTR, (C) SINE, (D) LINE, permuted means for 1283 random 30-kb genomic windows (number of, and average length of inferred coldspots). The red lines indicate the observed TE densities in the defined coldspot windows.
Association between recombination rate and base composition
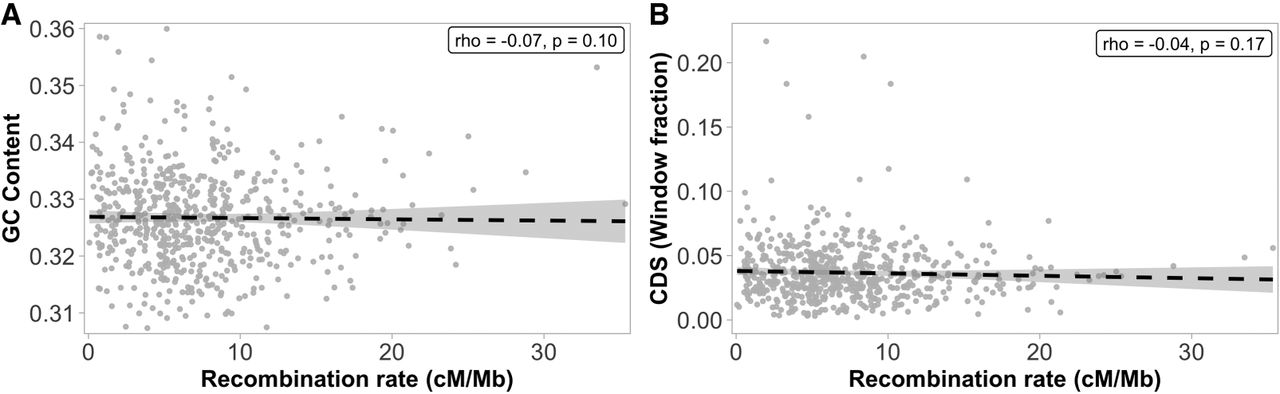
We assessed the association between recombination rate and nucleotide composition at a 1-Mb scale to investigate the potential effects of gBGC in the wood white genome. The analysis showed that the recombination rate was overall not significantly correlated with the GC content (Spearman's rho = −0.07, P = 0.10; Fig. 5A). In contrast, this association was negative and marginally significant for the chromosomes involved in fusion/fission polymorphisms (Spearman's rho = −0.19, P-value = 0.04; Supplemental Table 4).
Associations between the recombination rate and base composition (A) and gene density (B) in 1-Mb genomic windows. (A) Association between the recombination rate and the nucleotide composition (GC content). (B) Association between the recombination rate and the density of coding sequences (CDS).
Because we observed a significant reduction in recombination rate in subtelomeric regions, we investigated if those regions had deviating base composition. The analysis showed that there was a significantly higher GC content in subtelomeric regions (33.46%) compared to proximal regions (32.61%) (Wilcoxon's W = 1,109,810; P = 5.73 × 10⁻²²). The GC content was also slightly lower within hotspots (32.43%) and their 5 kb flanking regions (32.45%), compared to the genome-wide estimates (32.65%).
Associations between recombination rate and genomic features
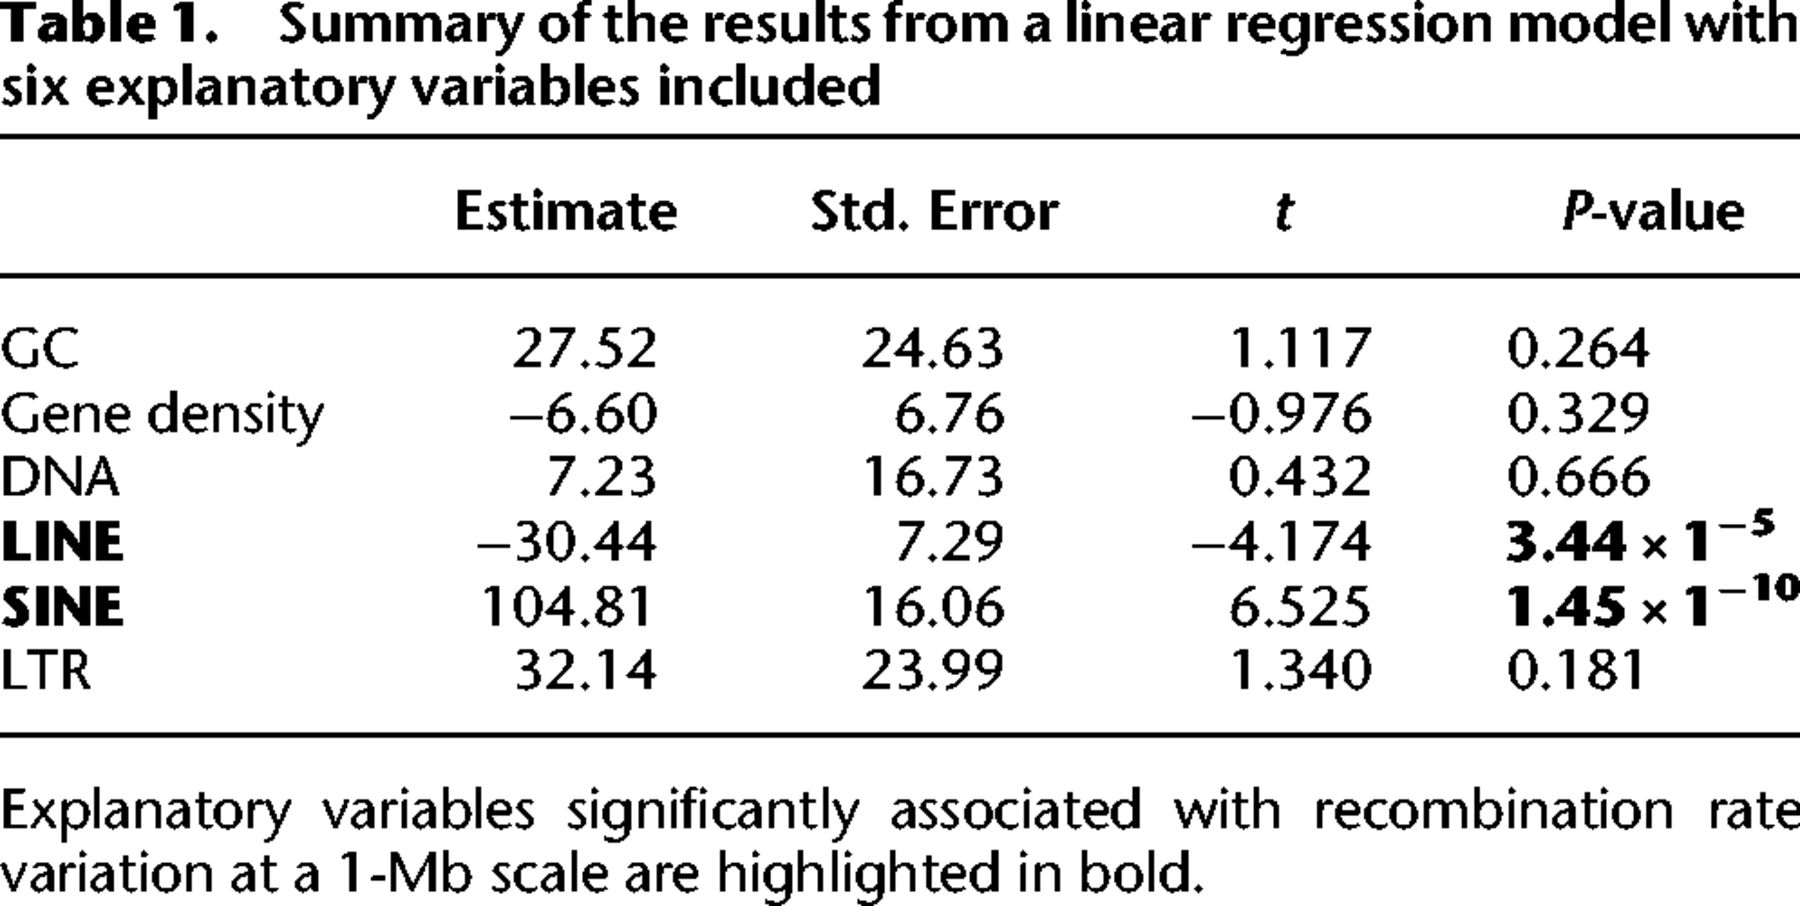
We used multiple regression to assess the relative effect of six explanatory variables (GC content, gene density, DNA transposon, SINE, LINE, and LTR retrotransposon densities) on the recombination rate. This model revealed an overall significant association between the recombination rate and the explanatory variables (F(6) = 10.77, df = 603, P = 2.13 × 10⁻¹¹), but explained only a small fraction of the total variation (R2 = 0.10, Adj R2 = 0.09). Only SINE and LINE densities were significant explanatory variables (Table 1).
Summary of the results from a linear regression model with six explanatory variables included
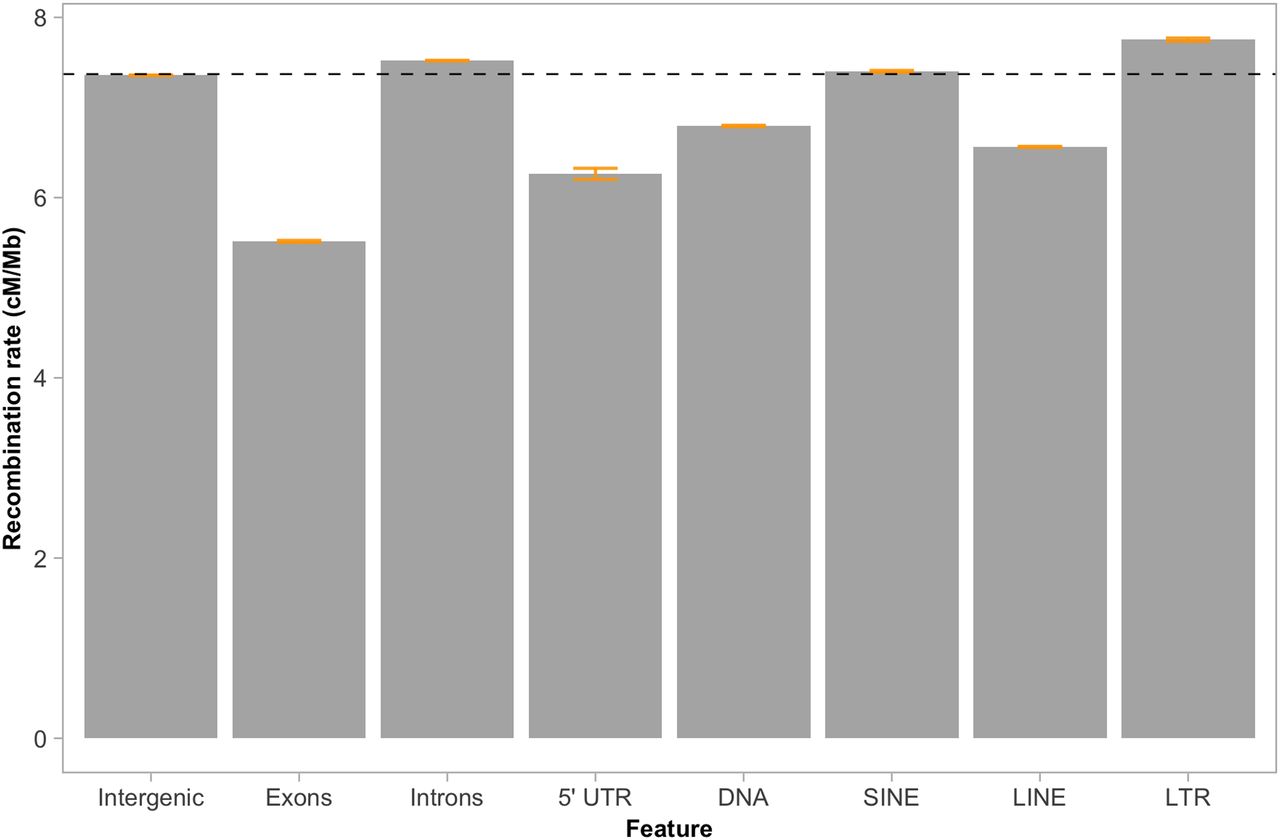
The recombination rate was neither associated with gene density in general (Spearman's rho = −0.04, P = 0.17; Fig. 5B), nor in chromosomes involved in segregating polymorphisms (P-value = 0.46, Supplemental Table 4). However, when analyzing different gene elements separately, we observed a significant reduction in recombination rate in exons (5.5 cM/Mb; Wilcoxon's W = 1.60 × 10¹⁰, P-value < 2.2 × 10⁻¹⁶) and 5′ UTRs (6.3 cM/Mb; Wilcoxon's W = 1.5869 × 10⁸, P-value < 2.2 × 10⁻¹⁶), and a significantly higher rate in introns (Wilcoxon's W = 7.3462 × 10¹², P-value < 2.2 × 10⁻¹⁶) compared to intergenic regions (7.5 cM/Mb) (Fig. 6).
Recombination rate estimates in different gene elements and classes of transposable elements. The genome-wide recombination rate (7.37 cM/Mb) is indicated with the horizontal black dashed line. Orange bars indicate 95% confidence intervals.
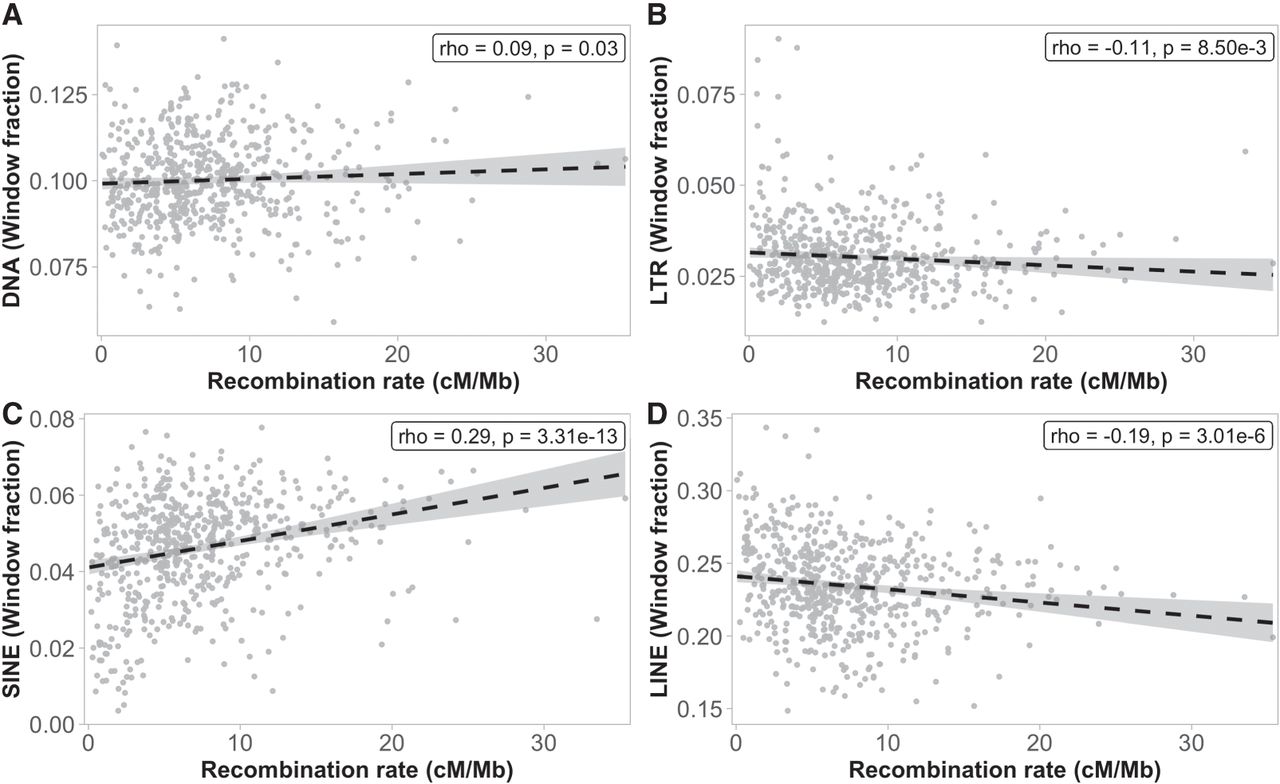
The recombination rate was differently associated with different TE classes, both in strength and direction. DNA transposons (Spearman's rho = 0.09, P = 0.03, Fig. 7A) and SINEs (Spearman's rho = 0.29, P = 3.31 × 10⁻¹³, Fig. 7C) were positively associated, and LTRs (Spearman's rho = −0.11, P = 8.50 × 10⁻³, Fig. 7B) and LINEs (Spearman's rho = −0.19, P = 3.01 × 10⁻⁶, Fig. 7D) negatively associated with the recombination rate. In the chromosomes involved in segregating polymorphisms, only SINEs showed a significant correlation with the recombination rate (P-value = 3.96 × 10⁻⁵; Supplemental Table 4), and they were also the only significant explanatory variable in the linear regression analysis of these specific chromosomes (Supplemental Table 5).
Associations between the recombination rate (1-Mb scale) and the proportion of four different TE classes; (A) DNA transposons, (B) LTRs, (C) SINEs, and (D) LINEs. The abundance of TEs was calculated as the fraction of each 1-Mb window occupied by each specific element.
Differences between TE classes were not restricted to the overall associations with recombination rate. The average recombination rate within each class of TEs also varied. The recombination rate was significantly lower for LINEs (6.6 cM/Mb; Wilcoxon's W = 5.233 × 10¹², P-value < 2.2 × 10⁻¹⁶) and DNA transposons (6.8 cM/Mb; Wilcoxon's W = 2.6104 × 10¹², P-value < 2.2 × 10⁻¹⁶), and significantly higher for SINEs (7.4 cM/Mb; Wilcoxon's W = 1.2212 × 10¹², P-value < 2.2 × 10⁻¹⁶) and LTRs (7.8 cM/Mb; Wilcoxon's W = 7.0468 × 10¹¹, P-value < 2.2 × 10⁻¹⁶), compared to the genome-wide estimates (Fig. 6).
Discussion
Recent demographic trends are the consequence of post-Pleistocene population dynamics
The demographic trajectories were consistent across chromosomes, and historical fluctuations in Ne were in agreement with previous analyses, showing a gradual increase until approximately 10,000 generations ago (Talla et al. 2019). By using a method (SMC++) that accommodates unphased data from many individuals, we could infer trajectories in the recent past (Terhorst et al. 2017). We found a considerable decrease in Ne in the last 10,000 generations, a signal that Talla et al. (2019) could not pick up with PSMC (Li and Durbin 2011), which uses genomic information from a single individual (Mather et al. 2020). The recent decline in Ne is consistent with recurrent founder effects during the recolonization of Scandinavia after the LGP, and is compatible with the hypothesis of secondary contact and recurrent backcrossing underlying the observed chromosome number cline across Eurasia (Lukhtanov et al. 2018; Talla et al. 2019). The negligible differences in Ne obtained when using different sets of “distinguished” individuals reinforce the reliability of using SMC++ (Terhorst et al. 2017) for inferences on the modern demographic history of populations.
An important consideration regarding the time estimates of the demographic changes is that the assumption of univoltinity may be an oversimplification of the historically true scenario. Currently, wood whites are univoltine in the northern parts of the distribution range (Friberg et al. 2008), but voltinity gradually increases further south (Dantart 2003; Jeffcoate and Joy 2011). Historical changes in voltinity (e.g., Powell 1989; Margus and Lindström 2020) could affect the scale of inferences on population size evolution. However, the timing of the ice sheet retreat in Scandinavia is estimated at about 11,000 yr BP (Günther et al. 2018), matching the beginning of the observed decrease in Ne, indicating it is most likely a consequence of founder effects during the recolonization of Scandinavia from glacial refugia.
Genome-wide distribution of the recombination rate in wood whites
The genome-wide recombination rate varies considerably between different insects, from comparatively low in Diptera (<1 cM/Mb) (Beye et al. 2006) to exceptionally high in honeybees (19 cM/Mb), (Beye et al. 2006). We found that the genome-wide recombination rate in the Swedish wood white population was 7.37 cM/Mb. This is slightly higher than estimates from other lepidopterans like Bombyx mori (4.6 cM/Mb), Heliconius melpomene (5.5 cM/Mb), and Heliconius erato (6 cM/Mb) (Yasukochi 1998; Jiggins et al. 2005; Tobler et al. 2005), and substantially higher than in vertebrates, which range between 0.16 cM/Mb in the Atlantic trout to 3.17 cM/Mb in chicken (Beye et al. 2006). The recombination rate here is also somewhat higher than linkage map-based estimates for the Swedish population of L. sinapis (Näsvall et al. 2023). This is very likely a consequence of scaling with Ne inferred from demographic trajectories, rather than a true difference between the historical recombination rate (i.e., ρ) and direct estimates of r in families. Because we focus on recombination rate variation along chromosomes here, exact estimates of r are not crucial, but caution is of course needed when comparing our results to estimates of genome-wide recombination rate obtained using different approaches. The ZW sex-chromosome system in Lepidoptera, where males are homogametic, coupled with achiasmy (i.e., no recombination) in females (Suomalainen et al. 1973), could theoretically lead to a higher recombination rate on the Z Chromosome. The reason for that is that the Z Chromosome spends 2/3 of the time (on evolutionary timescales) in a male germline and 1/3 in a female germline (given equal sex-ratio). Our results do not support such an effect because no significant difference in recombination rate was observed between autosomes and the Z Chromosomes.
A clearly deviating recombination rate was found for Chromosome 16 (15.3 cM/Mb), and that explains why the association between chromosome size and recombination was nonsignificant. Negative associations between both variables have been observed in different taxonomic groups, for example, yeast (Kaback et al. 1992), humans and rodents (Jensen-Seaman et al. 2004), birds (Backström et al. 2010), cattle (Mouresan et al. 2019), and butterflies (Martin et al. 2019; Shipilina et al. 2022). Such a relationship is expected as crossovers are necessary for correct chromosome segregation during meiosis (Pardo-Manuel de Villena and Sapienza 2001; Smith and Nambiar 2020). Another genomic region of interest is the 1-Mb window on Chromosome 17 with the highest recombination rate in the entire genome (Fig. 2). Previous studies have shown that assembly errors may lead to biased estimates of LD and population recombination rate (Wall et al. 2022). However, both the female and male genome assembly in L. sinapis are collinear in that region (Höök et al. 2023), indicating that the high recombination observed in the vicinity is genuine.
Our analysis also showed that longer chromosomes tended to have a bimodal recombination landscape, with a reduced rate at the chromosome center and toward the chromosome ends. This pattern is consistent with findings in both monocentric organisms where crossing-over events are rare within the centromeres (Dapper and Payseur 2017), and holocentric species (e.g., Caenorhabditis elegans), where the recombination rate increases with the relative distance from the center of the chromosomes (Prachumwat et al. 2004). In holocentric lineages, the bimodal recombination landscape in larger chromosomes can be explained by the accommodation of multiple chiasmata. For example, observations in Psylla foersteri suggest that longer chromosomes can accommodate the formation of two simultaneous chiasmata, whereas shorter chromosomes cannot (Nokkala et al. 2004). In the cases where two chiasmata are formed in a single chromosome, crossover interference may prevent those from forming near each other and tend to drive them toward opposite ends of the chromosome (Otto and Payseur 2019). An additional, but not mutually exclusive explanation, is the formation of the “meiotic bouquet”—a stage in early meiosis characterized by the aggregation of chromosome ends close to the nuclear membrane, which can drive crossovers toward distal positions and reduce the recombination rate in the center of the larger chromosomes (Scherthan et al. 1996; Haenel et al. 2018).
Apart from a reduced recombination rate in the center of larger chromosomes, we also found a reduced recombination rate in terminal regions. This pattern was observed in almost all chromosomes (see exceptions below), irrespective of chromosome size and type. Note that the telomeres, which in Lepidoptera are 6–8 kb long tandem repeats of the motif (TTAGG)n (Okazaki et al. 1993; Sasaki and Fujiwara 2000), were not assembled in the reference genome. Such decrease in the recombination rate in subtelomeric regions has previously been observed in Heliconius butterflies (Martin et al. 2019), as well as in yeast (DuBois et al. 2002; Barton et al. 2008) and flycatchers (Kawakami et al. 2017). A potential explanation for this pattern is that crossover initiation is prevented near the telomeres to minimize the risk for ectopic recombination between nonhomologous repeat sequences during meiosis (Smith and Nambiar 2020). As mentioned above, our results showed that the reduced recombination rate toward chromosome ends was not ubiquitous; eight chromosome ends (one for each of the following Chromosomes: 5, 6, 10, 11, 16, 25, 27, and 29) did not show a significant reduction in the recombination rate as compared to each respective intrachromosomal level. Four of these exceptions (one chromosome end for each of Chromosomes 5, 11, 25, and 27) coincide with recently identified fusion and fission polymorphisms segregating in the wood white Scandinavian population (Höök et al. 2023). These results show that fusion/fission events can have immediate effects on the distribution of crossovers within and between chromosomes.
Characterization of recombination hotspots and coldspots
The total number of hotspots (n = 3124) identified in the wood whites is similar to what was observed in Ficedula flycatchers using a comparable approach (Kawakami et al. 2017). The density of hotspots was, however, lower than in humans (n = 25,000–50,000 hotspots in an approximately five times larger genome) (Myers et al. 2005). Although the criteria for defining hotspots vary between studies, they all rely on contrasting the background and local recombination rates, making the results reasonably comparable. The distribution of hotspots is similar between wood whites and humans, as hotspots occurred mostly outside of genes (McVean et al. 2004). This is in contrast to birds, where genic and regulatory regions are enriched in hotspots (Singhal et al. 2015; Smeds et al. 2016; Kawakami et al. 2017). The frequency of recombination hotspots and coldspots was comparable in proximal regions, but the number of hotspots decreased, and coldspots were more frequent toward chromosome ends. A higher occurrence of recombination coldspots in terminal regions has previously been observed in yeast, which lack crossovers in chromosome ends altogether (Su et al. 2000; Barton et al. 2003). This observation is also in line with the observed decrease in average recombination rate in terminal regions in the wood whites and suggests that the recombination machinery is partly blocked from accessing the very ends of chromosomes.
We found that the recombination landscape in the wood white was highly variable. This is consistent with observations in humans (Mackiewicz et al. 2013), birds (Singhal et al. 2015), and dogs (Axelsson et al. 2012). However, other insects such as, for example, D. melanogaster (Comeron et al. 2012), for which detailed recombination maps are available, generally show less pronounced hotspots. Whereas the hotspot locations in humans are largely determined by the presence of sequence motifs associated with PRDM9 binding (Grey et al. 2011), little is known about what drives crossovers to occur at specific locations in organisms that lack a functional copy of PRDM9. To get preliminary information about potential mechanistic underpinnings of recombination rate variation in wood whites, we assessed if specific sequence motifs or gene categories were enriched in recombination hotspots and coldspots. The analyses did not reveal any associations for sequence motifs, and we found no enrichment of specific gene categories in hotspots. Coldspots, which experience almost no recombination, are interesting regions that can potentially be involved in the establishment of holocentromeres during meiosis in Lepidoptera. In these regions, we found a significant enrichment of genes with functions associated to transferase activity. Farnesyltranstransferase activity is a key step for the progression of cell division (Hussein and Taylor 2002) and correct attachment between the spindle and the kinetochores in humans (Moudgil et al. 2015). Although it is tempting to speculate that the active expression of farnesyltranstransferase might block the recombination machinery, their activity is expected to be transacting and they were found in only 13 of the coldspot regions. It is therefore not clear what the enrichment of farnesyltranstransferases in coldspots means from a mechanistic point of view, because other factors must underlie the repression of recombination in coldspots in general.
Associations between recombination, nucleotide composition, and gene content
The high-density recombination maps allowed us to investigate potential associations between the local recombination rate and different genomic features. Such information can be used to deduce the effects of recombination on base composition and/or regulatory mechanisms modulating the recombination landscape. A potential driver of an association between recombination and nucleotide composition is GC-biased gene conversion (gBGC), that is, the fixation bias favoring “strong” (G and C) over “weak” alleles (A and T) during recombination (Duret and Galtier 2009). This process mimics directional selection and can alter nucleotide composition between regions experiencing different recombination rates. We found no association between the overall recombination rate and nucleotide composition (GC content), and for chromosomes involved in fusion/fission polymorphisms there was a negative association. We also found that recombination hotspots had marginally lower GC content (the opposite is expected with gBGC; Kawakami et al. 2017), consistent with a limited effect of gBGC in butterflies (Boman et al. 2021), and in contrast to findings in several other systems like humans (Fullerton et al. 2001; Meunier and Duret 2004), mice (Clément and Arndt 2013), flycatchers (Kawakami et al. 2017) and fruit flies (Marais et al. 2001), as well as plants (Muyle et al. 2011) and yeast (Gerton et al. 2000; Kiktev et al. 2018). In yeast, plants, and humans, mononucleotide runs have been proposed as drivers of the association between recombination rate and nucleotide composition, counteracting the effects of gBGC on long-term nucleotide composition (Bagshaw et al. 2008; Leushkin and Bazykin 2013; Heissl et al. 2019). However, the enrichment analysis showed no overrepresentation of mononucleotide runs in either hotspots or coldspots, indicating that other factors mediate the recombination landscape in butterflies.
In many organisms, for example, mice (Paigen et al. 2008) and different plant species (Gaut et al. 2007; Tiley and Burleigh 2015), recombination occurs more frequently in gene-dense regions, but we did not find such an association in the wood whites. However, our data showed that the recombination rate was significantly reduced in exons and 5′ UTRs compared to introns and intergenic regions. This is in line with findings in other insects (Wallberg et al. 2015; Jones et al. 2019), and humans (McVean et al. 2004), where recombination hotspots concentrate in the vicinity of, but not within, coding and regulatory regions. The slightly elevated recombination rate in introns is consistent with findings in the holocentric nematode C. elegans (Prachumwat et al. 2004), but opposed to observations in Drosophila (Carvalho and Clark 1999) and humans (Comeron and Kreitman 2000). Taken together, this indicates that recombination occurs within genes in butterflies, but that crossovers are partly inhibited in coding sequences which might lead to a slightly elevated rate in introns.
Different TE classes show contrasting association patterns with the recombination rate
Associations between recombination and TE densities have mainly been investigated in organisms with defined centromeres (Kent et al. 2017), although data from holocentric species are scarce (but see Lavoie et al. 2013; Baril and Hayward 2022; Smolander et al. 2022). To assess the relationship between the recombination rate and genomic features in the wood white, we used TE annotation information previously developed for the species (Höök et al. 2023). This analysis revealed differential associations between the recombination rate and the abundance of distinct TE classes. DNA transposons and SINEs were positively associated, although LINEs and LTRs were negatively associated with the recombination rate. Under the assumption that TE insertions in general are slightly deleterious, we would expect a negative correlation between the recombination rate and TE abundance (Kent et al. 2017) as a consequence of more efficient purging of deleterious insertions in regions of high recombination rate (Bartolomé et al. 2002; Wright et al. 2003). However, given that recombination is initiated by a double-strand break, it is possible that certain TEs are used as a template for the repairing process, increasing their frequency in regions of higher recombination rates (Onozawa et al. 2014). SINEs have, for example, been shown to use DNA breaks to integrate back into the genome after replication (Singer 1982). Associations between TEs and the recombination rate are hence expected to depend on the TE class and the focal study system. For example, Alu elements (a subfamily of SINEs) in humans accumulate in regions with elevated recombination (Witherspoon et al. 2009), and SINEs are positively associated with the recombination rate in the painted lady (Vanessa cardui) (Shipilina et al. 2022). Similarly, DNA transposons are enriched in regions of high recombination rate in C. elegans (Duret et al. 2000). The causality of such associations is not easy to establish. In cases in which TE proliferation has deleterious fitness effects, we expect a negative association between TE abundance and recombination rate. However, Alu elements in humans have been shown to be drivers of an increase in the local recombination rate, possibly caused by Alu elements mimicking the action of short recombinogenic motifs (Witherspoon et al. 2009). It is also possible that other underlying factors affect the TE and recombination rate distributions similarly; both the TE proliferation and the recombination initiation machinery, for example, target open chromatin more easily (Kawakami et al. 2017). In the wood whites, the average recombination rate estimates within TE classes did not deviate considerably from the genome-wide average. However, these comparatively minor differences can indicate differences in the selective pressure against insertion of specific families of TEs. This does not seem to be related with the length of the TEs, as SINEs considerably shorter than LINEs and LTR elements showed an average recombination rate between the longer types. For chromosomes involved in fusion/fission polymorphisms, the only association between recombination rate and TE density was found for SINEs (positive). The lack of a negative association with LINEs and LTRs in the rearranged chromosomes may potentially be a consequence of reduced efficiency of selection (Dolgin and Charlesworth 2008), but could also just reflect reduced power in the analysis with the smaller set of data points.
In summary, the different TE classes showed different associations with the recombination rate. This is consistent with findings in other studies and may point toward similar determinants in holocentric organisms compared to those with defined centromeres. However, the causality needs further study through detailed characterization of crossover regions in large pedigrees.
Methods
Genome assembly
The wood white genome assembly used as reference was developed by Höök et al. (2023). In brief, one mated adult female wood white was caught in Sweden and reared for egg laying. One male offspring pupa was sampled and flash frozen in liquid nitrogen. The sample was divided to create a 10x Genomics Chromium Genome-library and a Dovetail Hi-C library. For 10x sequencing, DNA was extracted using a modified HMW salt extraction method (Aljanabi and Martinez 1997). Tissue for Hi-C sequencing was disrupted in liquid nitrogen. Library preparation, sequencing, and genome assembly were performed by NGI Stockholm. Sequencing was performed on Illumina NovaSeq 6000 with 2 × 151 setup. 10x linked-reads were assembled with 10x Genomics Supernova v2.1.0 (Weisenfeld et al. 2017). Hi-C reads were processed with Juicer v1.6 (Durand et al. 2016a) and used for scaffolding the 10x assembly with 3DDNA v.180922 (Dudchenko et al. 2017). Resulting assemblies were reviewed with Juicebox v1.11.08 (Durand et al. 2016b). In addition to minor corrections to the initial assembly, two chromosome-sized scaffolds were merged. The assembly was finalized with the script “run-asm-pipeline-post-review.sh” from 3DDNA v.180922 (Dudchenko et al. 2017).
Gene annotation
Gene annotation liftOver was performed by aligning wood white protein queries generated by Talla et al. (2017) to the current version of reference genome, using spaln 2.4.0 (Iwata and Gotoh 2012) with parameters -Q7 -LS -O7 -S3.
TE annotation
Repetitive consensus sequences were predicted de novo using RepeatModeler 1.0.11 (Bao et al. 2015). TEs characterized as unknown were submitted to CENSOR (Bao et al. 2015) for annotation, where hits with a score < 200 were removed. Predicted sequences were matched against gene annotations using DIAMOND BLAST 2.0.4 (Buchfink et al. 2021), to correct for annotation errors (bitscore > 100). TEs were annotated in the genome with RepeatMasker 4.1.0, using the predicted library of consensus sequences in wood white and previously characterized TEs in Heliconius melpomene in the RepeatMasker library 4.0.8 (Bao et al. 2015).
Sampling of individuals
Adult male wood whites were collected across Sweden during June and July 2020 (Supplemental Table 6). Sex was determined in situ based on two sexually dimorphic characters: the presence of a black apical forewing spot and white coloration of the ventral part of the antennae in males. Sampled individuals were preserved in ethanol and frozen at −20°C.
DNA extraction
DNA was extracted following two protocols. In both, the dissected tissue was digested overnight in Laird's buffer and homogenized with 20 μL of Proteinase K (20 mg/mL, >600 mAU/mL), and incubated with RNase A at 37°C for 30 min. DNA from thoraces was extracted using salt extraction; 300 μL of 5M NaCl was added, followed by centrifugation for 15 min at 13,000 revolutions per minute (rpm). Three washing steps were completed with one volume of 70% ethanol and centrifuging for 5 min at maximum speed. The pellet was air-dried and then resuspended in 30 μL of Milli-Q H2O. For the abdomens, a phenol-chloroform extraction protocol was used. Two cycles of phenol:chloroform:isoamyl alcohol (25:24:1) addition and centrifugation for 5 min at 13,000 rpm were completed, plus a third cleaning cycle using only chloroform. DNA precipitation was achieved by adding 2× volumes isopropanol + 0.1× 3M NaAc, incubating at −18°C overnight and centrifuging 15 min at 13,000 rpm. The final pellet was resuspended with 30 μL of Milli-Q H2O. DNA purity was assessed with NanoDrop, and concentration measured with Qubit DNA Broad Range.
Sequencing
84 individuals with the highest DNA quality representing the distribution range were selected. Library preparation for all 84 samples using the TruSeq PCR-free kit followed by multiplexing, and sequencing on two NovaSeq 6000 S4 lanes with 2 × 150 bp reads, were performed by NGI Stockholm.
Read trimming
Illumina adapters were trimmed by eliminating 15 bp on each end of the raw reads with cutadapt 1.9.1 (Martin 2011), filtered on Q-score < 30 and minimum length of 30 bp. Read quality postcleaning was assessed with FastQC (https://www.bioinformatics.babraham.ac.uk/projects/fastqc/). Before filtering, 4.3 million reads per sample were obtained on average, and 2.5% were filtered out.
Mapping and filtering
Paired-end reads were mapped to the reference genome with BWA v0.7.17 (Li and Durbin 2009). SAMtools v1.10 (Li et al. 2009) was used to select reads with paired information. Duplicates were eliminated with MarkDuplicatesSpark as implemented in GATK v4.1.4.1 (McKenna et al. 2010) with the ‐‐remove-sequencing-duplicates option.
Variant calling and filtering
GATK's v4.1.4.1 HaplotypeCaller (McKenna et al. 2010) was used for variant calling. All chromosomes and individuals were called independently, and the resulting 84 files for each chromosome were grouped into a single VCF file with the GATK's v4.1.4.1 Combine_gVCF and Genotype_gVCF (McKenna et al. 2010). Total variant count was obtained with the stats option in BCFtools v1.10 (Li 2011). Variants were filtered to have a minimum minor allele count of two, per site depth between 10 and 50, minimum per site quality of 30, and <20% per site missing data, using VCFtools 0.1.15 (Danecek et al. 2011). Insertions and deletions were removed with the ‐‐remove-indels option. The number of remaining sites in each chromosome was counted again with the stats option in BCFtools v1.10 (Li 2011). Initial variant calling resulted in 51,189,479 markers (11,055,543 indels + 40,133,936 SNPs), 10,565,404 SNPs remaining after filtering. This represents a genome-wide average of ∼17.6 SNPs/kb, given the ∼ 600-per Mb total length of the reference genome.
Inference of the demographic history
The demographic history for each chromosome was inferred with SMC++ (Terhorst et al. 2017) using six “distinguished” individuals. These were selected based on high sequencing coverage after filtering and to be representative of the geographic distribution. SMC++ vcf2smc was run for each “distinguished” individual, taking the allelic state of all other samples into account for the final output. SMC++’s estimate was used to infer the demographic history of each chromosome by incorporating the genealogical information of all six runs and computing the composite likelihood. The per base, per generation mutation rate was set at 2.9 × 10⁻⁹, based on mutation frequency estimations in H. melpomene (Keightley et al. 2015). Invariable regions such as centromeres must be masked before demographic inferences, as they can interfere with the signal. Because Lepidoptera are holocentric and lack defined centromeres, a cutoff value of 150 kb was set instead, so that any longer invariable region was considered as missing data and discarded for the demographic inference. The demographic trajectories were inferred for the last 5 × 10⁶ generations. To test the accuracy of the inferences, the demographic analyses were performed again using a randomly selected set of six distinguished individuals. The most recent estimates of Ne, which are key for scaling the population recombination rate with pyrho (Spence and Song 2019), were used to assess if the choice of distinguished individuals significantly changed the output.
Recombination rate estimation
The chromosome-specific demographic trajectories were used together with the VCF files to obtain high-resolution recombination maps using pyrho (Spence and Song 2019). An algorithm implemented in LDpop (Kamm et al. 2016) was used to compute two-loci likelihoods under the coalescent with recombination using the chromosome-specific demographic trajectories as input. The same mutation rate as before was used, together with the parameter values n = 168 (twice the number of diploid individuals), and N = 210 (25% larger than n, as recommended in the manual). A relative tolerance (‐‐decimate_rel_tol) of 0.1 was used with the ‐‐approx flag, recommended for large data sets. Different window sizes (maximum distance between SNPs) and block penalties (determinant of the smoothness of the curve) were tested for each chromosome, and those with the highest correlation between the likelihood tables and simulated data at different scales (1 bp, 10 kb, and 100 kb) were selected. For all chromosomes, the best block_penalty was 25, and the best suitable window_size ranged between 50 and 100. The look-up table and the final VCF file for each chromosome were used to infer the local recombination rate using the most appropriate parameter values and the ‐‐fast_missing flag. The per base, per generation recombination rate between each pair of SNP markers was obtained in the end. Our short-read data did not allow for the elimination of heterozygous individuals for the identified rearrangements. However, fusion/fission polymorphisms in the species are comparatively recent with respect to the buildup of LD patterns, hence they should not be a major cause of biases in the inferences and scaling from ρ to r. A positive association between the recombination rate and marker density was observed at a 1-Mb scale (Supplemental Information; Supplemental Fig. 3).
Distribution of recombination rate variation and identification of hotspots and coldspots
Regional recombination rate estimates were obtained in two window sizes (100 kb and 1 Mb) by calculating the weighted average recombination rate between markers, accounting for the distance between them. We used a simulation-based approach to establish thresholds for hotspot identification. Coalescent simulations were used to assess how much of the variation inferred by pyrho was caused by our imputation strategy. msprime 1.1.1 (Kelleher et al. 2016) was used to simulate 99 independent sequences, each 100 kb long, and the VCF files for each sequence were concatenated. The parameters for the simulations included a flat recombination landscape (7.37 cM/Mb, the genome-wide average) and the same mutation rate used for SMC++, together with an approximation of the demographic trajectory inferred from the empirical data; exponential growth in the interval 104–106 generations BP, exponential decline 102–104 generations BP, and stable size in the last 102 generations. At each time point, Ne was calculated as the average of the estimates across chromosomes. The simulated genomic sequences were analyzed in pyrho according to the steps described earlier. The resulting regional recombination rates predominantly oscillated in the range 2–8 cM/Mb, with a maximum of 20 cM/Mb, roughly threefold higher than the genome-wide average (Supplemental Fig. 4). Recombination peaks occurring at boundaries between independently obtained VCF files were omitted. Therefore, simulations allowed us to establish a lower threshold for hotspot consideration. For the final (more conservative) criteria, we defined hotspots as regions with a recombination rate higher than 25 cM/Mb, between 750 and 10,000 bp long, and showing a 10-fold increase over the regional “background” recombination rate. This “background” recombination rate was established for each 100-kb window, as the average rate for the focal window and the two flanking windows, in total 300 kb. To avoid biases resulting from erroneously called variants, hotspots that included less than four markers (i.e., three intervals) were discarded. Recombination coldspots were identified as regions with a recombination rate 10-fold lower than the genome-wide average, and including ≥4 markers with no length limitations.
To assess the distribution of recombination hotspots and coldspots, we defined the subtelomeric regions as the last 500 kb on each chromosome end. The rest of the genome was considered proximal. Flanks of recombination hotspots were defined as the 5-kb segments at each side of the defined hotspots.
Associations between recombination rate with GC content, gene density, and classes
A linear regression model was applied to disentangle the explanatory potential of each genomic feature for the recombination rate variation at a 1-Mb scale, using the lm function in base R (R Core Team 2021). The model had recombination rate as the response variable, and the explanatory variables were GC content, gene density, and the relative abundance of four TE classes (DNA transposons, and LINE, SINE, and LTR retrotransposons). Potential associations between local recombination rate and the different genomic features were also analyzed with Spearman's rank correlation tests using the corr option in base R (R Core Team 2021).
BEDTools 2.29.2 (Quinlan and Hall 2010) maskfasta was used to select all annotated exons and TEs. Base composition for specific regions (corrected for masked positions) was obtained with BEDTools nuc option. Gene and TE densities were calculated as the proportion of a region covered by the annotated sequences of each category.
To assess the variation in the recombination rate within genomic features, we estimated the recombination rate within each TE class, different regions in protein-coding genes (exons, introns, and upstream regions) and intergenic sequences. Because 5′ UTRs were not annotated, we used the 100-bp upstream of each gene's first exon, a conservative selection to represent 5′ UTRs (Chen et al. 2011, 2014). To avoid biases caused by differential selective pressures, only the intervals between SNPs within a feature were considered; for example, for a given exon, if an interval between markers overlapped completely with the predicted exon, it was retained; if the overlap was only partial (including part of the exon sequence but also part of a neighboring intron or UTR), it was discarded. This overlap was checked with BEDTools 2.29.2 (Quinlan and Hall 2010) intersect option using the flag -f 1.
Permutation test to assess TE density in the coldspots and hotspots
We ran 10,000 permutation tests in R v4.2.1 (R Core Team 2021) with windows reflecting the count and average length of recombination hotspots and coldspots to obtain neutral distributions of TE abundances. We then compared these distributions with the empirical data and assessed the significance of our findings with two-sided tests.
Gene Set Enrichment Analysis (GSEA) for the genes present in the coldspot and hotspot regions
We assessed potential enrichment of functional categories in the hotspot and coldspot regions using topGO v2.44.0 (https://bioconductor.org/packages/release/bioc/html/topGO.html) in R v4.2.1 (R Core Team 2021). We used the annotated gene set with Gene Ontology (GO) terms associated to molecular function and Fisher's exact test to test for significance, with the default algorithm (“weight01”) to account for the hierarchical structure of the GO terms (Alexa et al. 2006). We adjusted the P-values with Benjamini–Hochberg's method of multiple test correction (p.adjust(x, method = “fdr”)). HOMER v4.11 (Heinz et al. 2010) was used to check for enriched sequence motifs within the coldspots and hotspots by comparing the abundance of oligonucleotide sequences with background genome-wide frequencies, with autonormalization of up to 3-mers.
Data access
All raw data generated in this study have been submitted to the European Nucleotide Archive (ENA; https://www.ebi.ac.uk/ena/browser/home) under accession number PRJEB56690. The VCF files for each chromosome that were used for the demographic inferences and recombination rate estimations have been submitted to Dryad (doi: https://doi.org/10.5061/dryad.qrfj6q5m7). Dovetail Omni-C raw data (Höök et al. 2023) for the reference genome used here is available at ENA under accession number PRJEB58697. In-house developed scripts and pipelines are available as Supplemental Code and on GitHub (https://github.com/EBC-butterfly-genomics-team/Leptidea-sinapis-Recombination-Rate).
Competing interest statement
The authors declare no competing interests.
Acknowledgments
This work was supported by a research grant from the Swedish Research Council (Vetenskapsrådet Grant ID#: 2019-04791) to N.B. The authors acknowledge support from the National Genomics Infrastructure in Stockholm funded by Science for Life Laboratory, the Knut and Alice Wallenberg Foundation and the Swedish Research Council, and SNIC/Uppsala Multidisciplinary Center for Advanced Computational Science for assistance with massively parallel sequencing and access to the UPPMAX computational infrastructure. This work was also supported by NBIS/SciLifeLab long-term bioinformatics support (WABI). R.V. was supported by Grant No. PID2019-107078GB-I00, funded by Ministerio de Ciencia e Innovación–Agencia Estatal de Investigación MCIN/AEI/10.13039/501100011033.
Notes
[1] Supplementary material [Supplemental material is available for this article.]
[2] Article published online before print. Article, supplemental material, and publication date are at https://www.genome.org/cgi/doi/10.1101/gr.277414.122.
[3] Freely available online through the Genome Research Open Access option.
References
- ↵Ahola V, Lehtonen R, Somervuo P, Salmela L, Koskinen P, Rastas P, Välimäki N, Paulin L, Kvist J, Wahlberg N, 2014. The Glanville fritillary genome retains an ancient karyotype and reveals selective chromosomal fusions in Lepidoptera. Nat Commun 5: 4737. 10.1038/ncomms5737
- ↵Alexa A, Rahnenführer J, Lengauer T. 2006. Improved scoring of functional groups from gene expression data by decorrelating GO graph structure. Bioinformatics 22: 1600–1607. 10.1093/bioinformatics/btl140
- ↵Aljanabi SM, Martinez I. 1997. Universal and rapid salt-extraction of high quality genomic DNA for PCR-based techniques. Nucleic Acids Res 25: 4692–4693. 10.1093/nar/25.22.4692
- ↵Axelsson E, Webster MT, Ratnakumar A, The LUPA Consortium, Ponting CP, Lindblad-Toh K. 2012. Death of PRDM9 coincides with stabilization of the recombination landscape in the dog genome. Genome Res 22: 51–63. 10.1101/gr.124123.111
- ↵Backström N, Forstmeier W, Schielzeth H, Mellenius H, Nam K, Bolund E, Webster MT, Öst T, Schneider M, Kempenaers B, 2010. The recombination landscape of the zebra finch Taeniopygia guttata genome. Genome Res 20: 485–495. 10.1101/gr.101410.109
- ↵Bagshaw ATM, Pitt JPW, Gemmell NJ. 2008. High frequency of microsatellites in S. cerevisiae meiotic recombination hotspots. BMC Genomics 9: 49. 10.1186/1471-2164-9-49
- ↵Baker Z, Schumer M, Haba Y, Bashkirova L, Holland C, Rosenthal GG, Przeworski M. 2017. Repeated losses of PRDM9-directed recombination despite the conservation of PRDM9 across vertebrates. eLife 6: e24133. 10.7554/eLife.24133
- ↵Bao W, Kojima KK, Kohany O. 2015. Repbase Update, a database of repetitive elements in eukaryotic genomes. Mob DNA 6: 11. 10.1186/s13100-015-0041-9
- ↵Baril T, Hayward A. 2022. Migrators within migrators: exploring transposable element dynamics in the monarch butterfly, Danaus plexippus. Mob DNA 13: 5. 10.1186/s13100-022-00263-5
- ↵Bartolomé C, Maside X, Charlesworth B. 2002. On the abundance and distribution of transposable elements in the genome of Drosophila melanogaster. Mol Biol Evol 19: 926–937. 10.1093/oxfordjournals.molbev.a004150
- ↵Barton AB, Su Y, Lamb J, Barber D, Kaback DB. 2003. A function for subtelomeric DNA in Saccharomyces cerevisiae. Genetics 165: 929–934. 10.1093/genetics/165.2.929
- ↵Barton AB, Pekosz MR, Kurvathi RS, Kaback DB. 2008. Meiotic recombination at the ends of chromosomes in Saccharomyces cerevisiae. Genetics 179: 1221–1235. 10.1534/genetics.107.083493
- ↵Bergero R, Charlesworth D. 2009. The evolution of restricted recombination in sex chromosomes. Trends Ecol Evol 24: 94–102. 10.1016/j.tree.2008.09.010
- ↵Beye M, Gattermeier I, Hasselmann M, Gempe T, Schioett M, Baines JF, Schlipalius D, Mougel F, Emore C, Rueppell O, 2006. Exceptionally high levels of recombination across the honey bee genome. Genome Res 16: 1339–1344. 10.1101/gr.5680406
- ↵Boman J, Mugal CF, Backström N. 2021. The effects of GC-biased gene conversion on patterns of genetic diversity among and across butterfly genomes. Genome Biol Evol 13: evab064. 10.1093/gbe/evab064
- ↵Buchfink B, Reuter K, Drost HG. 2021. Sensitive protein alignments at tree-of-life scale using DIAMOND. Nat Methods 18: 366–368. 10.1038/s41592-021-01101-x
- ↵Carvalho A, Clark A. 1999. Intron size and natural selection. Nature 401: 344. 10.1038/43827
- ↵Charlesworth B. 1994. The effect of background selection against deleterious mutations on weakly selected, linked variants. Genet Res (Camb) 63: 213–227. 10.1017/S0016672300032365
- ↵Chen C, Lin H, Pan C, Chen F. 2011. The length evolution of 5′ untranslated regions - the stochastic model revisited. In IEEE International Conference on Bioinformatics and Engineering, Taichung, Taiwan, pp. 162–166. 10.1109/BIBE.2011.32
- ↵Chen X, Lü X, Zhang Y. 2014. Characterization of protein phosphatase 5 from three Lepidopteran insects: Helicoverpa armigera, Mythimna separata and Plutella xylostella. PLoS One 9: e97437. 10.1371/journal.pone.0097437
- ↵Choi K, Henderson IR. 2015. Meiotic recombination hotspots – a comparative view. Plant J 83: 52–61. 10.1111/tpj.12870
- ↵Clément Y, Arndt PF. 2013. Meiotic recombination strongly influences GC-content evolution in short regions in the mouse genome. Mol Biol Evol 30: 2612–2618. 10.1093/molbev/mst154
- ↵Comeron JM. 2017. Background selection as null hypothesis in population genomics: insights and challenges from Drosophila studies. Philos Trans R Soc Lond B Biol Sci 372: 20160471. 10.1098/rstb.2016.0471
- ↵Comeron JM, Kreitman M. 2000. The correlation between intron length and recombination in Drosophila: dynamic equilibrium between mutational and selective forces. Genetics 156: 1175–1190. 10.1093/genetics/156.3.1175
- ↵Comeron JM, Ratnappan R, Bailin S. 2012. The many landscapes of recombination in Drosophila melanogaster. PLoS Genet 8: e1002905. 10.1371/journal.pgen.1002905
- ↵Cutter AD, Payseur BA. 2013. Genomic signatures of selection at linked sites: unifying the disparity among species. Nat Rev Genet 14: 262–274. 10.1038/nrg3425
- ↵Danecek P, Auton A, Abecasis G, Albers CA, Banks E, DePristo MA, Handsaker RE, Lunter G, Marth GT, Sherry ST, 2011. The variant call format and VCFtools. Bioinformatics 27: 2156–2158. 10.1093/bioinformatics/btr330
- ↵Dantart J. 2003. Leptidea sinapis and L. reali, sibling species as yet poorly known in Catalonia. Cynthia: Bulletin of the Catalan Butterfly Monitoring Scheme 3: 5–6.
- ↵Dapper AL, Payseur BA. 2017. Connecting theory and data to understand recombination rate evolution. Philos Trans R Soc Lond B Biol Sci 372: 20160469. 10.1098/rstb.2016.0469
- ↵Davey JW, Barker SL, Rastas PM, Pinharanda A, Martin SH, Durbin R, McMillan WO, Merrill RM, Jiggins CD. 2017. No evidence for maintenance of a sympatric Heliconius species barrier by chromosomal inversions. Evolution Lett 1: 138–154. 10.1002/evl3.12
- ↵Dincă V, Lukhtanov VA, Talavera G, Vila R. 2011. Unexpected layers of cryptic diversity in wood white Leptidea butterflies. Nat Commun 2: e324. 10.1038/ncomms1329
- ↵Dolgin ES, Charlesworth B. 2008. The effects of recombination rate on the distribution and abundance of transposable elements. Genetics 178: 2169–2177. 10.1534/genetics.107.082743
- ↵DuBois ML, Haimberger ZW, McIntosh MW, Gottschling DE. 2002. A quantitative assay for telomere protection in Saccharomyces cerevisiae. Genetics 161: 995–1013. 10.1093/genetics/161.3.995
- ↵Dudchenko O, Batra SS, Omer AD, Nyquist SK, Hoeger M, Durand NC, Shamim MS, Machol I, Lander ES, Aiden AP, 2017. De novo assembly of the Aedes aegypti genome using Hi-C yields chromosome-length scaffolds. Science 356: 92–95. 10.1126/science.aal3327
- ↵Durand NC, Shamim MS, Machol I, Rao SS, Huntley MH, Lander ES, Aiden EL. 2016a. Juicer provides a one-click system for analyzing loop-resolution Hi-C experiments. Cell Syst 3: 95–98. 10.1016/j.cels.2016.07.002
- ↵Durand NC, Robinson JT, Shamim MS, Machol I, Mesirov JP, Lander ES, Aiden EL. 2016b. Juicebox provides a visualization system for Hi-C contact maps with unlimited zoom. Cell Syst 3: 99–101. 10.1016/j.cels.2015.07.012
- ↵Duret L, Galtier N. 2009. Biased gene conversion and the evolution of mammalian genomic landscapes. Annu Rev Genomics Hum Genet 10: 285–311. 10.1146/annurev-genom-082908-150001
- ↵Duret L, Marais G, Biémont C. 2000. Transposons but not retrotransposons are located preferentially in regions of high recombination rate in Caenorhabditis elegans. Genetics 156: 1661–1669. 10.1093/genetics/156.4.1661
- ↵Friberg M, Bergman M, Kullberg J, Wahlberg N, Wiklund C. 2008. Niche separation in space and time between two sympatric sister species—a case of ecological pleiotropy. Evol Ecol 22: 1–18. 10.1007/s10682-007-9155-y
- ↵Fullerton SM, Bernardo Carvalho A, Clark AG. 2001. Local rates of recombination are positively correlated with GC content in the human genome. Mol Biol Evol 18: 1139–1142. 10.1093/oxfordjournals.molbev.a003886
- ↵Gaut B, Wright S, Rizzon C, Dvorak J, Anderson LK. 2007. Recombination: an underappreciated factor in the evolution of plant genomes. Nat Rev Genet 8: 77–84. 10.1038/nrg1970
- ↵Gerton JL, DeRisi J, Shroff R, Lichten M, Brown PO, Petes TD. 2000. Global mapping of meiotic recombination hotspots and coldspots in the yeast Saccharomyces cerevisiae. Proc Natl Acad Sci 97: 11383–11390. 10.1073/pnas.97.21.11383
- ↵Gray S, Cohen PE. 2016. Control of meiotic crossovers: from double-strand break formation to designation. Annu Rev Genet 50: 175–210. 10.1146/annurev-genet-120215-035111
- ↵Grey C, Barthès P, Chauveau-Le Friec G, Langa F, Baudat F, De Massy B. 2011. Mouse PRDM9 DNA-binding specificity determines sites of histone H3 lysine 4 trimethylation for initiation of meiotic recombination. PLoS Biol 9: e1001176. 10.1371/journal.pbio.1001176
- ↵Günther T, Malmström H, Svensson EM, Omrak A, Sánchez-Quinto F, Kılınç GM, Krzewińska M, Eriksson G, Fraser M, Edlund H, 2018. Population genomics of mesolithic scandinavia: investigating early postglacial migration routes and high-latitude adaptation. PLoS Biol 16: e2003703. 10.1371/journal.pbio.2003703
- ↵Haenel Q, Laurentino TG, Roesti M, Berner D. 2018. Meta-analysis of chromosome-scale crossover rate variation in eukaryotes and its significance to evolutionary genomics. Mol Ecol 27: 2477–2497. 10.1111/mec.14699
- ↵Heinz S, Benner C, Spann N, Bertolino E, Lin YC, Laslo P, Cheng JX, Murre C, Singh H, Glass CK. 2010. Simple combinations of lineage-determining transcription factors prime cis-regulatory elements required for macrophage and B cell identities. Mol Cell 38: 576–589. 10.1016/j.molcel.2010.05.004
- ↵Heissl A, Betancourt AJ, Hermann P, Povysil G, Arbeithuber B, Futschik A, Ebner T, Tiemann-Boege I. 2019. The impact of poly-A microsatellite heterologies in meiotic recombination. Life Sci Alliance 2: e201900364. 10.26508/lsa.201900364
- ↵Höök L, Näsvall K, Vila R, Wiklund C, Backström N. 2023. High-density linkage maps and chromosome level genome assemblies unveil direction and frequency of extensive structural rearrangements in wood white butterflies (Leptidea spp.). Chromosome Res 31: 2. 10.1007/s10577-023-09713-z
- ↵Hussein D, Taylor SS. 2002. Farnesylation of Cenp-F is required for G2/M progression and degradation after mitosis. J Cell Sci 115: 3403–3414. 10.1242/jcs.115.17.3403
- ↵Iwata H, Gotoh O. 2012. Benchmarking spliced alignment programs including Spaln2, an extended version of Spaln that incorporates additional species-specific features. Nucleic Acids Res 40: e161. 10.1093/nar/gks708
- ↵Jeffcoate S, Joy J. 2011. Evidence-based national recovery plan for Leptidea sinapis (wood white butterfly) in Southern Britain. J Insect Conserv 15: 759–763. 10.1007/s10841-010-9374-3
- ↵Jensen-Seaman MI, Furey TS, Payseur BA, Lu Y, Roskin KM, Chen CF, Thomas MA, Haussler D, Jacob HJ. 2004. Comparative recombination rates in the rat, mouse, and human genomes. Genome Res 14: 528–538. 10.1101/gr.1970304
- ↵Jiggins CD, Mavarez J, Beltrán M, McMillan WO, Spencer Johnston J, Bermingham E. 2005. A genetic linkage map of the mimetic butterfly Heliconius melpomene. Genetics 171: 557–570. 10.1534/genetics.104.034686
- ↵Johnston SE, Bérénos C, Slate J, Pemberton JM. 2016. Conserved genetic architecture underlying individual recombination rate variation in a wild population of soay sheep (Ovis aries). Genetics 203: 583–598. 10.1534/genetics.115.185553
- ↵Jones JC, Wallberg A, Christmas MJ, Kapheim KM, Webster MT. 2019. Extreme differences in recombination rate between the genomes of a solitary and a social bee. Mol Biol Evol 36: 2277–2291. 10.1093/molbev/msz130
- ↵Kaback DB, Guacci V, Barber D, Mahon JW. 1992. Chromosome size-dependent control of meiotic recombination. Science 256: 228–232. 10.1126/science.1566070
- ↵Kamm JA, Spence JP, Chan J, Song YS. 2016. Two-locus likelihoods under variable population size and fine-scale recombination rate estimation. Genetics 203: 1381–1399. 10.1534/genetics.115.184820
- ↵Kawakami T, Mugal CF, Suh A, Nater A, Burri R, Smeds L, Ellegren H. 2017. Whole-genome patterns of linkage disequilibrium across flycatcher populations clarify the causes and consequences of fine-scale recombination rate variation in birds. Mol Ecol 26: 4158–4172. 10.1111/mec.14197
- ↵Keightley PD, Pinharanda A, Ness RW, Simpson F, Dasmahapatra KK, Mallet J, Davey JW, Jiggins CD. 2015. Estimation of the spontaneous mutation rate in Heliconius melpomene. Mol Biol Evol 32: 239–243. 10.1093/molbev/msu302
- ↵Kelleher J, Etheridge AM, McVean G. 2016. Efficient coalescent simulation and genealogical analysis for large sample sizes. PLoS Comput Biol 12: e1004842. 10.1371/journal.pcbi.1004842
- ↵Kent TV, Uzunović J, Wright SI. 2017. Coevolution between transposable elements and recombination. Philos Trans R Soc Lond B Biol Sci 372: 20160458. 10.1098/rstb.2016.0458
- ↵Kiktev DA, Sheng Z, Lobachev KS, Petes TD. 2018. GC content elevates mutation and recombination rates in the yeast Saccharomyces cerevisiae. Proc Natl Acad Sci 115: E7109–E7118. 10.1073/pnas.1807334115
- ↵Lavoie CA, Platt RN, Novick PA, Counterman BA, Ray DA. 2013. Transposable element evolution in Heliconius suggests genome diversity within Lepidoptera. Mob DNA 4: 21. 10.1186/1759-8753-4-21
- ↵Leushkin E, Bazykin GA. 2013. Short indels are subject to insertion-bias gene conversion. Evolution (N Y) 67: 2604–2613. 10.1111/evo.12129
- ↵Li H. 2011. A statistical framework for SNP calling, mutation discovery, association mapping and population genetical parameter estimation from sequencing data. Bioinformatics 27: 2987–2993. 10.1093/bioinformatics/btr509
- ↵Li H, Durbin R. 2009. Fast and accurate short read alignment with Burrows–Wheeler transform. Bioinformatics 25: 1754–1760. 10.1093/bioinformatics/btp324
- ↵Li H, Durbin R. 2011. Inference of human population history from individual whole-genome sequences. Nature 475: 493–496. 10.1038/nature10231
- ↵Li H, Handsaker B, Wysoker A, Fennell T, Ruan J, Homer N, Marth G, Abecasis G, Durbin R, 1000 Genome Project Data Processing Subgroup. 2009. The Sequence Alignment/Map format and SAMtools. Bioinformatics 25: 2078–2079. 10.1093/bioinformatics/btp352
- ↵Lukhtanov VA, Dincă V, Friberg M, Šíchová J, Olofsson M, Vila R, Marec F, Wiklund C. 2018. Versatility of multivalent orientation, inverted meiosis, and rescued fitness in holocentric chromosomal hybrids. Proc Natl Acad Sci 115: E9610–E9619. 10.1073/pnas.1802610115
- ↵Mackiewicz D, Castro de Oliveira PM, Moss de Oliveira S, Cebrat S. 2013. Distribution of recombination hotspots in the human genome – a comparison of computer simulations with real data. PLoS One 8: e65272. 10.1371/journal.pone.0065272
- ↵Marais G, Mouchiroud D, Duret L. 2001. Does recombination improve selection on codon usage? lessons from nematode and fly complete genomes. Proc Natl Acad Sci 98: 5688–5692. 10.1073/pnas.091427698
- ↵Margus A, Lindström L. 2020. Prolonged diapause has sex-specific fertility and fitness costs. Evol Ecol 34: 41–57. 10.1007/s10682-019-10024-1
- ↵Martin M. 2011. Cutadapt removes adapter sequences from high-throughput sequencing reads. EMBnet.journal 17: 10–12. 10.14806/ej.17.1.200
- ↵Martin SH, Davey JW, Salazar C, Jiggins CD. 2019. Recombination rate variation shapes barriers to introgression across butterfly genomes. PLoS Biol 17: e2006288. 10.1371/journal.pbio.2006288
- ↵Mather N, Traves SM, Ho SYW. 2020. A practical introduction to sequentially markovian coalescent methods for estimating demographic history from genomic data. Ecol Evol 10: 579–589. 10.1002/ece3.5888
- ↵Maynard Smith J, Haigh J. 1974. The hitch-hiking effect of a favourable gene. Genet Res 23: 23–35.
- ↵McKenna A, Hanna M, Banks E, Sivachenko A, Cibulskis K, Kernytsky A, Garimella K, Altshuler D, Gabriel S, Daly M, 2010. The Genome Analysis Toolkit: a MapReduce framework for analyzing next-generation DNA sequencing data. Genome Res 20: 1297–1303. 10.1101/gr.107524.110
- ↵McVean GAT, Myers SR, Hunt S, Deloukas P, Bentley DR, Donnelly P. 2004. The fine-scale structure of recombination rate variation in the human genome. Science 304: 581–584. 10.1126/science.1092500
- ↵Meunier J, Duret L. 2004. Recombination drives the evolution of GC-content in the human genome. Mol Biol Evol 21: 984–990. 10.1093/molbev/msh070
- ↵Moens PB, Kolas NK, Tarsounas M, Marcon E, Cohen PE, Spyropoulos B. 2002. The time course and chromosomal localization of recombination-related proteins at meiosis in the mouse are compatible with models that can resolve the early DNA-DNA interactions without reciprocal recombination. J Cell Sci 115: 1611–1622. 10.1242/jcs.115.8.1611
- ↵Moudgil DK, Westcott N, Famulski JK, Patel K, Macdonald D, Hang H, Chan GKT. 2015. A novel role of farnesylation in targeting a mitotic checkpoint protein, human Spindly, to kinetochores. J Cell Biol 208: 881–896. 10.1083/jcb.201412085
- ↵Mouresan EF, González-Rodríguez A, Cañas-Álvarez JJ, Munilla S, Altarriba J, Díaz C, Baró JA, Molina A, López-Buesa P, Piedrafita J, 2019. Mapping recombination rate on the autosomal chromosomes based on the persistency of linkage disequilibrium phase among autochthonous beef cattle populations in Spain. Front Genet 10: 1170. 10.3389/fgene-2019.01170
- ↵Muyle A, Serres-Giardi L, Ressayre A, Escobar J, Glémin S. 2011. GC-biased gene conversion and selection affect GC content in the Oryza genus (rice). Mol Biol Evol 28: 2695–2706. 10.1093/molbev/msr104
- ↵Myers S, Bottolo L, Freeman C, McVean G, Donelly P. 2005. A fine-scale map of recombination rates and hotspots across the human genome. Science 310: 321–324. 10.1126/science.1117196
- ↵Näsvall K, Boman J, Höök L, Vila R, Wiklund C, Backström N. 2023. Nascent evolution of recombination rate differences as a consequence of chromosomal rearrangements. bioRxiv 10.1101/2023.03.27.534312
- ↵Nokkala S, Kuznetsova VG, Maryanska-Nadachowska A, Nokkala C. 2004. Holocentric chromosomes in meiosis. I. restriction of the number of chiasmata in bivalents. Chromosome Res 12: 733–739. 10.1023/B:CHRO.0000045797.74375.70
- ↵Okazaki S, Tsuchida K, Maekawa H, Ishikawa H, Fujiwara H. 1993. Identification of a pentanucleotide telomeric sequence, (TTAGG)n, in the silkworm Bombyx mori and in other insects. Mol Cell Biol 13: 1424–1432. 10.1128/mcb.13.3.1424-1432.1993
- ↵Oliver PL, Goodstadt L, Bayes JJ, Birtle Z, Roach KC, Phadnis N, Beatson SA, Lunter G, Malik HS, Ponting CP. 2009. Accelerated evolution of the Prdm9 speciation gene across diverse metazoan taxa. PLoS Genet 5: e1000753. 10.1371/journal.pgen.1000753
- ↵Onozawa M, Zhang Z, Kim YJ, Goldberg L, Varga T, Leif Bergsagel P, Kuehl WM, Aplan PD. 2014. Repair of DNA double-strand breaks by templated nucleotide sequence insertions derived from distant regions of the genome. Proc Natl Acad Sci 111: 7729–7734. 10.1073/pnas.1321889111
- ↵Otto SP, Payseur BA. 2019. Crossover interference: shedding light on the evolution of recombination. Annu Rev Genet 53: 19–44. 10.1146/annurev-genet-040119-093957
- ↵Paigen K, Szatkiewicz JP, Sawyer K, Leahy N, Parvanov ED, Ng SH, Graber JH, Broman KW, Petkov PM. 2008. The recombinational anatomy of a mouse chromosome. PLoS Genet 4: e1000119. 10.1371/journal.pgen.1000119
- ↵Pardo-Manuel de Villena F, Sapienza C. 2001. Recombination is proportional to the number of chromosome arms in mammals. Mamm Genome 12: 318–322. 10.1007/s003350020005
- ↵Peñalba JV, Wolf JBW. 2020. From molecules to populations: appreciating and estimating recombination rate variation. Nat Rev Genet 21: 476–492. 10.1038/s41576-020-0240-1
- ↵Petrov DA, Fiston-Lavier AS, Lipatov M, Lenkov K, González J. 2011. Population genomics of transposable elements in Drosophila melanogaster. Mol Biol Evol 28: 1633–1644. 10.1093/molbev/msq337
- ↵Powell JA. 1989. Synchronized, mass-emergences of a yucca moth, prodoxus Y-inversus (Lepidoptera: Prodoxidae), after 16 and 17 years in diapause. Oecologia 81: 490–493. 10.1007/BF00378957
- ↵Prachumwat A, DeVincentis L, Palopoli MF. 2004. Intron size correlates positively with recombination rate in Caenorhabditis elegans. Genetics 166: 1585–1590. 10.1534/genetics.166.3.1585
- ↵Quinlan AR, Hall IM. 2010. BEDTools: a flexible suite of utilities for comparing genomic features. Bioinformatics 26: 841–842. 10.1093/bioinformatics/btq033
- ↵R Core Team. 2021. R: a language and environment for statistical computing. R Foundation for Statistical Computing, Vienna. https://www.R-project.org/.
- ↵Robinson R. 1971. Lepidoptera genetics, 1st ed. Pergamon Press, Oxford.
- ↵Samuk K, Manzano-Winkler B, Ritz KR, Noor MAF. 2020. Natural selection shapes variation in genome-wide recombination rate in Drosophila pseudoobscura. Curr Biol 30: 1517–1528.e6. 10.1016/j.cub.2020.03.053
- ↵Sasaki T, Fujiwara H. 2000. Detection and distribution patterns of telomerase activity in insects. Eur J Biochem 267: 3025–3031. 10.1046/j.1432-1033.2000.01323.x
- ↵Scherthan H, Weich S, Schwegler H, Heyting C, Härle M, Cremer T. 1996. Centromere and telomere movements during early meiotic prophase of mouse and man are associated with the onset of chromosome pairing. J Cell Biol 134: 1109–1125. 10.1083/jcb.134.5.1109
- ↵Shipilina D, Näsvall K, Höök L, Vila R, Talavera G, Backström N. 2022. Linkage mapping and genome annotation give novel insights into gene family expansions and regional recombination rate variation in the painted lady (Vanessa cardui) butterfly. Genomics 114: 110481. 10.1016/j.ygeno.2022.110481
- ↵Singer MF. 1982. SINEs and LINEs: highly repeated short and long interspersed sequences in mammalian genomes. Cell 28: 433–434. 10.1016/0092-8674(82)90194-5
- ↵Singhal S, Leffler EM, Sannareddy K, Turner I, Venn O, Hooper DM, Strand AI, Li Q, Raney B, Balakrishnan CN, 2015. Stable recombination hotspots in birds. Science 350: 928–932. 10.1126/science.aad0843
- ↵Smeds L, Mugal CF, Qvarnström A, Ellegren H. 2016. High-resolution mapping of crossover and noncrossover recombination events by whole-genome re-sequencing of an avian pedigree. PLoS Genet 12: e1006044. 10.1371/journal.pgen.1006044
- ↵Smith GR, Nambiar M. 2020. New solutions to old problems: molecular mechanisms of meiotic crossover control. Trends Genet 36: 337–346. 10.1016/j.tig.2020.02.002
- ↵Smolander O-P, Blande D, Ahola V, Rastas P, Tanskanen J, Kammonen JI, Oostra V, Pellegrini L, Ikonen S, Dallas T, 2022. Improved chromosome-level genome assembly of the glanville fritillary butterfly (Melitaea cinxia) integrating Pacific Biosciences long reads and a high-density linkage map. GigaScience 11: giab097. 10.1093/gigascience/giab097
- ↵Smukowski CS, Noor MA. 2011. Recombination rate variation in closely related species. Heredity (Edinb) 107: 496–508. 10.1038/hdy.2011.44
- ↵Spence JP, Song YS. 2019. Inference and analysis of population-specific fine-scale recombination maps across 26 diverse human populations. Sci Adv 5: eaaw9206. 10.1126/sciadv.aaw9206
- ↵Stapley J, Feulner PGD, Johnston SE, Santure AW, Smadja CM. 2017. Variation in recombination frequency and distribution across eukaryotes: patterns and processes. Philos Trans R Soc Lond B Biol Sci 372: 20160455. 10.1098/rstb.2016.0455
- ↵Su Y, Barton AB, Kaback DB. 2000. Decreased meiotic reciprocal recombination in subtelomeric regions in Saccharomyces cerevisiae. Chromosoma 109: 467–475. 10.1007/s004120000098
- ↵Suomalainen E. 1953. The kinetochore and the bivalent structure in the Lepidoptera. Hereditas 39: 88–96. 10.1111/j.1601-5223.1953.tb03403.x
- ↵Suomalainen E, Cook LM, Turner JRG. 1973. Achiasmatic oogenesis in the Heliconiine butterflies. Hereditas 74: 302–304. 10.1111/j.1601-5223.1973.tb01134.x
- ↵Talla V, Suh A, Kalsoom F, Dincă V, Vila R, Friberg M, Wiklund C, Backström B. 2017. Rapid increase in genome size as a consequence of transposable element hyperactivity in wood-white (Leptidea) butterflies. Genome Biol Evol 9: 2491–2505. 10.1093/gbe/evx163
- ↵Talla V, Johansson A, Dincă V, Vila R, Friberg M, Wiklund C, Backström N. 2019. Lack of gene flow: narrow and dispersed differentiation islands in a triplet of Leptidea butterfly species. Mol Ecol 28: 3756–3770. 10.1111/mec.15188
- ↵Terhorst J, Kamm J, Song Y. 2017. Robust and scalable inference of population history from hundreds of unphased whole genomes. Nat Genet 49: 303–309. 10.1038/ng.3748
- ↵Tiley GP, Burleigh JG. 2015. The relationship of recombination rate, genome structure, and patterns of molecular evolution across angiosperms. BMC Evol Biol 15: 194. 10.1186/s12862-015-0473-3
- ↵Tobler A, Kapan D, Flanagan NS, Gonzalez C, Peterson E, Jiggins CD, Johnston JS, Heckel DG, McMillan WO. 2005. First-generation linkage map of the warningly colored butterfly Heliconius erato. Heredity (Edinb) 94: 408–417. 10.1038/sj.hdy.6800619
- ↵Wall JD, Robinson JA, Cox LA. 2022. High-resolution estimates of crossover and noncrossover recombination from a captive baboon colony. Genome Biol Evol 14: evac040. 10.1093/gbe/evac040
- ↵Wallberg A, Glémin S, Webster MT. 2015. Extreme recombination frequencies shape genome variation and evolution in the honeybee, Apis mellifera. PLoS Genet 11: e1005189. 10.1371/journal.pgen.1005189
- ↵Weisenfeld NI, Kumar V, Shah P, Church DM, Jaffe DB. 2017. Direct determination of diploid genome sequences. Genome Res 27: 757–767. 10.1101/gr.214874.116
- ↵Witherspoon DJ, Watkins WS, Zhang Y, Xin J, Tolpinrud WL, Hedges DJ, Batzer MA, Borde LB. 2009. Alu repeats increase local recombination rates. BMC Genomics 10: 530. 10.1186/1471-2164-10-530
- ↵Wright SI, Agrawal N, Bureau TE. 2003. Effects of recombination rate and gene density on transposable element distributions in Arabidopsis thaliana. Genome Res 13: 1897–1903. 10.1101/gr.1281503
- ↵Xu YX, Du JC. 2014. Young but not relatively old retrotransposons are preferentially located in gene-rich euchromatic regions in tomato (Solanum lycopersicum) plants. Plant J 80: 582–591. 10.1111/tpj.12656
- ↵Yasukochi Y. 1998. A dense genetic map of the silkworm, Bombyx mori, covering all chromosomes based on 1018 molecular markers. Genetics 150: 1513–1525. 10.1093/genetics/150.4.1513