Abstract
Recent studies have demonstrated extensive transcriptional activity across the human genome, a substantial fraction of which is not associated with any functional annotation. However, very little is known regarding the post-transcriptional processes that operate within the different classes of RNA molecules. To characterize the post-transcriptional properties of expressed sequences from human chromosome 21 (HSA21), we separated RNA molecules from three cell lines (GM06990, HeLa S3, and SK-N-AS) according to their ribosome content by sucrose gradient fractionation. Polyribosomal-associated RNA and total RNA were subsequently hybridized to genomic tiling arrays. We found that ∼50% of the transcriptional signals were located outside of annotated exons and were considered as TARs (transcriptionally active regions). Although TARs were observed among polysome-associated RNAs, RT-PCR and RACE experiments revealed that ∼40% were likely to represent nonspecific cross-hybridization artifacts. Bioinformatics discrimination of TARs according to conservation and sequence complexity allowed us to identify a set of high-confidence TARs. This set of TARs was significantly depleted in the polysomes, suggesting that it was not likely to be involved in translation. Analysis of polysome representation of RefSeq exons showed that at least 15% of RefSeq transcripts undergo significant post-transcriptional regulation in at least two of the three cell lines tested. Among the regulated transcripts, enrichment analysis revealed an over-representation of genes involved in Alzheimer's disease (AD), including APP and the BACE1 protease that cleaves APP to produce the pathogenic beta 42 peptide. We demonstrate that the combination of RNA fractionation and tiling arrays is a powerful method to assess the transcriptional and post-transcriptional properties of genomic regions.
Following the near completion of the human genome (International Human Genome Sequencing Consortium 2001, 2004; Levy et al. 2007) attention has focused on the identification and characterization of the functional elements that are encoded within the sequence (The ENCODE Project Consortium 2007).
Comparative genomic studies using the genomes of several mammals have shown that ∼5% of the genome is under selective constraint (Waterston et al. 2002; The ENCODE Project Consortium 2007). Protein-coding genes comprise only about a third of this fraction (International Human Genome Sequencing Consortium 2001; The ENCODE Project Consortium 2007), indicating that other potentially functional elements account for the remainder (Drake et al. 2006). The study of conserved noncoding regions (Dermitzakis et al. 2002, 2003) has suggested that a number of these are involved in gene regulation (Pennacchio et al. 2006; Prabhakar et al. 2006). In addition, a fraction of nonconserved sequences might also be functionally relevant (Numata et al. 2007; Tsuritani et al. 2007). Several recent studies have revealed that the transcriptome of mammalian cells is more complex than previously anticipated, with an increasingly large number of alternative isoforms of known genes (Harrow et al. 2006) and abundant transcriptional activity outside of annotated genes, most of it in nonconserved regions (Kapranov et al. 2002; Rinn et al. 2003; Bertone et al. 2004; Rozowsky et al. 2007; Borel et al. 2008; Wu et al. 2008). However, to date, there is little information regarding the regulation or function of these novel transcriptional units, which have been termed transfrags (transcribed fragments) or TARs (transcriptionally active regions) (Kapranov et al. 2002; Rinn et al. 2003).
Numerous studies have used available technologies, including expression microarrays and quantitative RT-PCR, to analyze the transcriptome. One limitation of these approaches is the lack of information regarding key post-transcriptional regulatory events that contribute substantially to the protein readout (Shoemaker et al. 2001; Bild et al. 2006; Gilchrist et al. 2006). Translational initiation, for instance, has been shown to be particularly important in cell cycle control (Campo et al. 2002), the stress response (Sherrill and Lloyd 2008), and apoptosis (Graber and Holcik 2007).
Numerous studies have shown that the 5′ and 3′ untranslated regions (UTRs) play key roles in the translational regulation of individual mRNAs (Wickens et al. 1997; Gray and Wickens 1998; Mignone et al. 2002). The length of the 5′ UTR, its secondary structure, the number of upstream AUG codons, and the number of upstream open reading frames (uORFs) are thought to be important parameters in the regulation of translational initiation (Iacono et al. 2005). In addition, internal ribosome entry sites (IRESs) have been described in some 5′ UTRs, providing an alternative to CAP-dependant initiation (Jackson 1988; Ting and Lee 1988; Sarnow 1989; Macejak and Sarnow 1991).
The paucity of data concerning translational regulation reflects the technical challenges involved in high-throughput measurements of protein concentrations (Patterson 2003; Wilkins et al. 2006). An alternative approach to estimate the relative translational efficiency of transcripts is to separate the RNAs according to their polyribosome content by sucrose gradient fractionation. The distribution of different RNA molecules on the polysome fractions has been suggested to be proportional to the rate of protein synthesis (Serikawa et al. 2003), although this correlation is certainly not always linear (Johannes et al. 1999).
In this study we investigated the patterns of transcriptional activity and post-transcriptional regulation on HSA21 using a custom-designed genomic tiling array comprising the entire nonrepetitive sequence of HSA21q (16.6 Mb), and one ENCODE pilot region ENm001 (1 Mb). We hybridized total and polyribosome-associated RNAs from three different cell lines in order to investigate (1) likely functional nonannotated transcriptional units (transfrags/TARs), (2) genes that undergo post-transcriptional regulation, and (3) the role of 5′ UTR features in translational regulation.
Results and Discussion
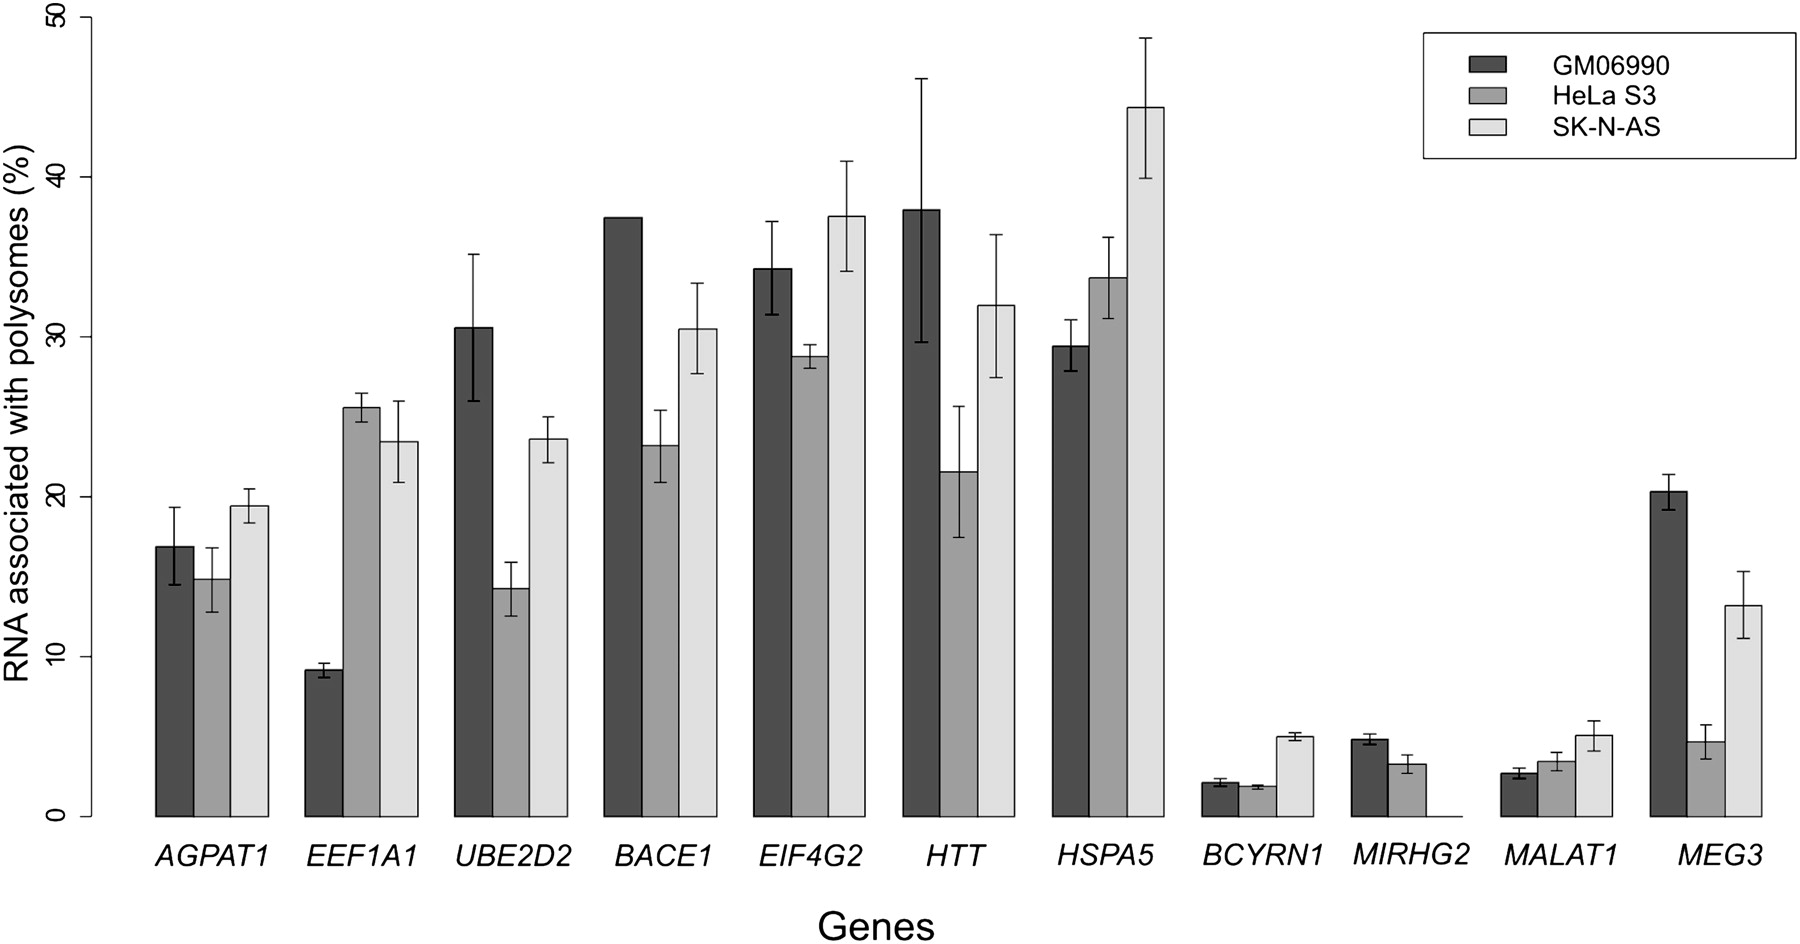
We hybridized total and polysome-associated RNAs from three cell lines (GM06990, HeLa S3, and SK-N-AS) to HSA21 genomic tiling arrays in order to investigate the transcriptional and post-transcriptional properties of genes and other functional elements within this chromosome. To evaluate the quality of our polysomal fractionation prior to hybridization, we used quantitative RT-PCR (qPCR) with specific TaqMan probes for 11 genes, including three housekeeping genes, four genes previously described to undergo post-transcriptional regulation, and four nonprotein-coding RNAs (BCYRN1, MIRHG2, MALAT1, and MEG3). To estimate the relative representation of each transcript in the polysomal fraction, we calculated the ratio of polysome-associated/total RNA for each gene. The qPCR results clearly demonstrated that although all transcripts were present at some level in the polysome fraction, the noncoding RNAs showed the lowest levels of polysome association (as a percentage of the total), as would be expected given that they are not translated. This suggests that the RNA fractionation step worked efficiently (Fig. 1).
Percent level of transcript representation in the polysomal fraction as measured using quantitative reverse transcription PCR. Bars correspond to the standard deviation. BCYRN1, MIRHG2, MALAT1, MEG3 are noncoding genes, while all others are protein-coding genes.
Description of positive signals on the array
Transcriptionally active regions were identified from the tiling array experiments using a stringent algorithm described in the Methods section. Data obtained from the three cell lines revealed that 3.9%–6.8% of the target sequences analyzed showed transcriptional activity on the arrays (Fig. 2A), and about 8.9% of the chromosome was transcriptionally active in at least one cell line. This level exceeds the gene annotations by more than twofold and is consistent with previous reports (Kapranov et al. 2002; Rinn et al. 2003).
(A) Percentage of positive signals detected on the custom tiling array when hybridizing total RNA from three different cell lines. (B) Overlap of positive signals with known annotations: (1) RefSeq exons; (2) human mRNAs (not included in 1); (3) ESTs (not included in 1 and 2); (4) nTAR (novel transcriptionally active regions). (C) Comparative conservation density plot of RefSeq exons and nTARs using phastCons scores. (D) Comparative density plot of percentages of low-complexity DNA between RefSeq exons and nTARs.
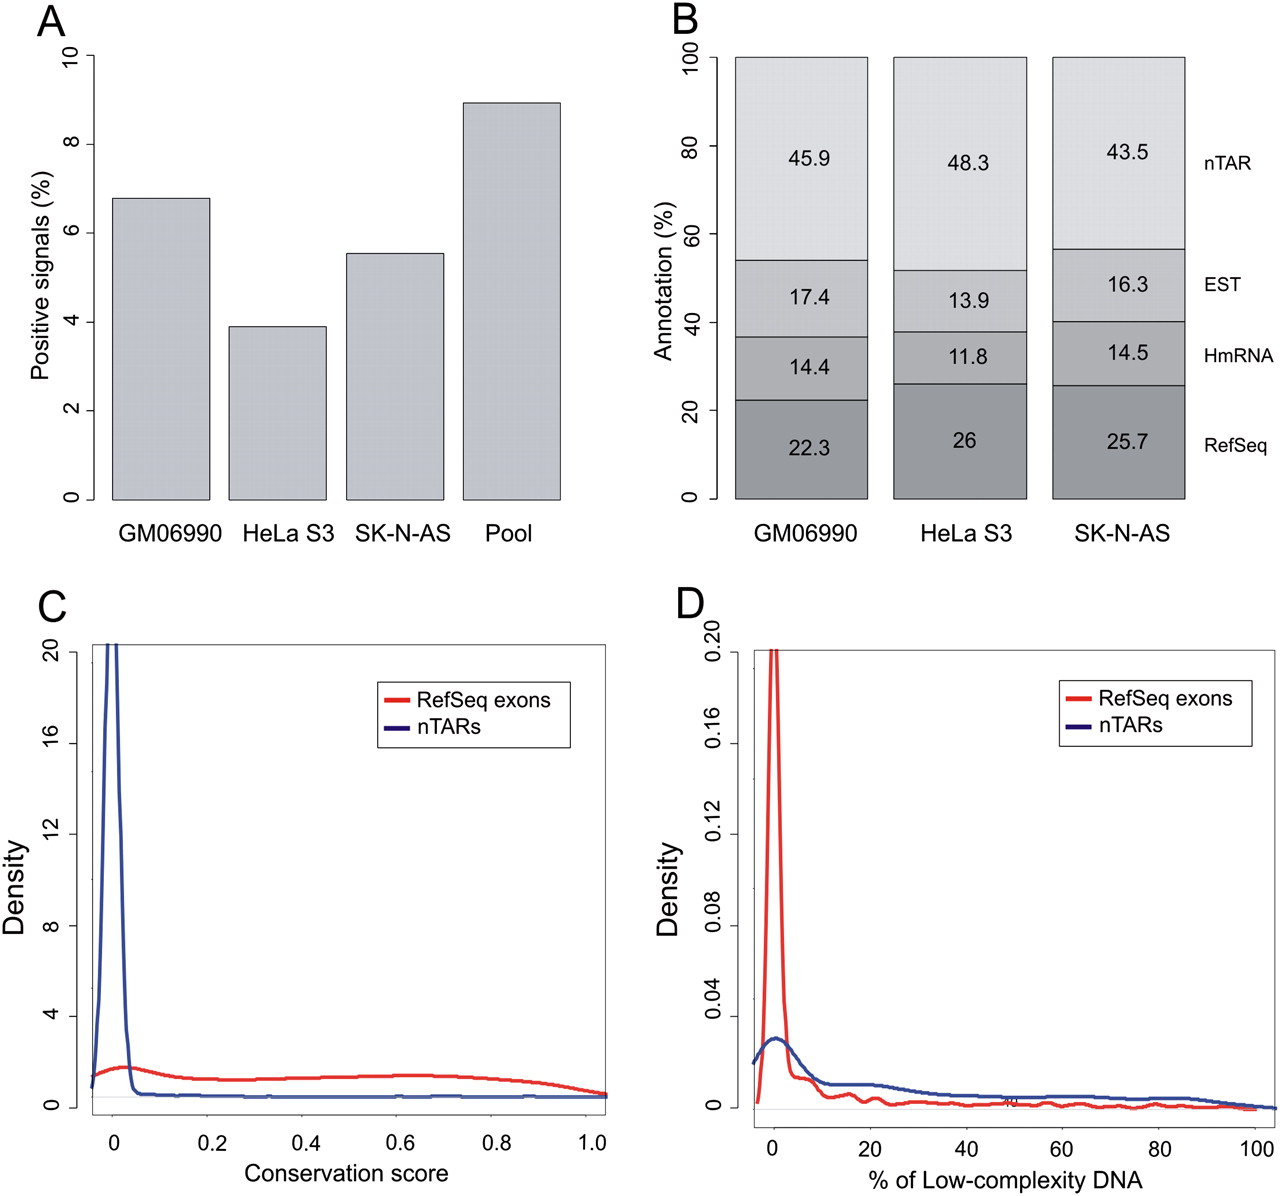
We compared the positive signals from each array with previous annotations. Annotation tracks were downloaded from the UCSC Genome Browser in order to calculate the overlap of positive signals with (1) RefSeq exons, (2) human mRNAs (not included in 1), and expressed sequence tags (ESTs) (not included in 1 and 2). Approximately 50% of the signals were found to correspond to a known mRNA or EST sequence (Fig. 2B), but as previously observed in similar experiments (Rozowsky et al. 2007; Wu et al. 2008), about half of the positive signals did not overlap with any previous annotation and can therefore be classified as transfrags/TARs. Interestingly, over 30% of the nonannotated transcribed regions detected in our experiments overlap with previously reported transfrags/TARs (Cheng et al. 2005). To avoid confusion with previously reported data, we will refer to the nonannotated expressed regions from this study as novel TARs or nTARs.
We next looked at the evolutionary sequence conservation and DNA complexity of our experimentally determined nTARs and compared it with the positive signals overlapping with RefSeq exons. In terms of conservation, as expected, expressed regions corresponding to RefSeq exons showed a substantial level of conservation with a median phastCons score of 0.425, whereas the majority of nTARs were not conserved (Fig. 2C). In terms of sequence complexity, RefSeq-expressed elements contained a small fraction of low-complexity sequence (Fig. 2D), with over 90% of the exons containing <10% low-complexity sequence. The distribution of low-complexity signals was very different for nTARs, for which we observed that ∼70% of the sequences had at least 10% of low-complexity content (Kruskal-Wallis P-value < 2.2 × 10⁻¹⁶).
To further characterize the transcriptional properties of nTARs, we first compared them with expressed RefSeq exons in terms of transcriptional intensity (Fig. 3A, top). The intensities of nTARs on the total RNA arrays were substantially lower than that of RefSeq exons in all three cell lines studied. In the HeLa S3 cell line, this difference was less pronounced, although still highly significant (P = 8.61 × 10⁻⁸). This is consistent with previous observations (The ENCODE Project Consortium 2007).
(A) (Top) Distribution of log2 intensities of array signals from total RNAs in three cell types. The red line corresponds to RefSeq exons and the blue line to nTARs. (Bottom) Distribution ratios of polysome associated RNA/Total RNA signals. (B) RT-PCR of selected nTARs. (+) RT+, (−) RT−, (P.C) positive control (RefSeq exon), (N.C) negative control (nontranscribed DNA). (C) RACE experiment from forward strand and reverse-strand primers in three cell types. The red circle indicates an example of nonspecific cross-hybridization. (D) BLAT results from the UCSC Genome Browser of B1 nTAR and RACE from the SK-N-AS cell line. Coordinates of nTARs are presented in Supplemental Table 1.
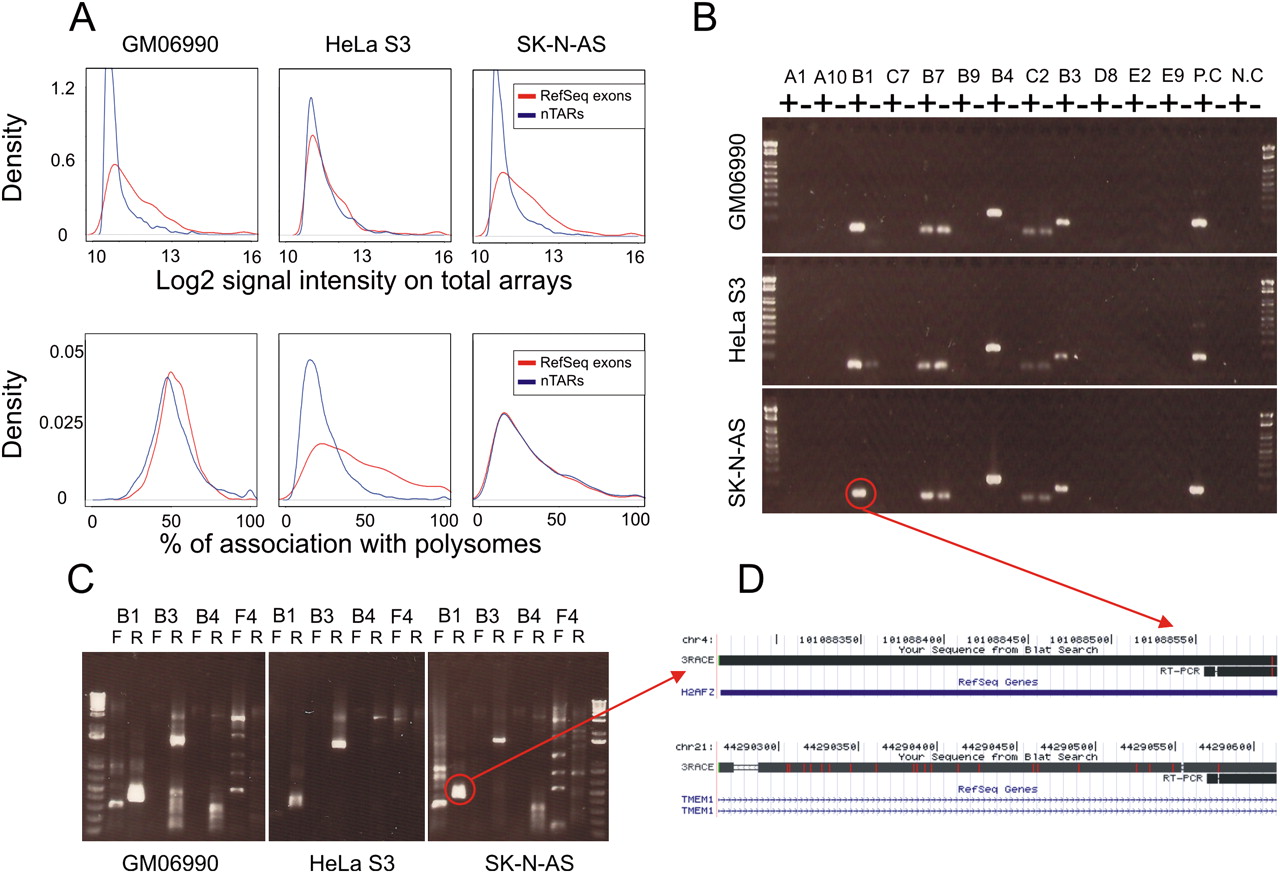
Since very little is known concerning the function of nTARs, it was interesting to evaluate whether they associated with polyribosomes, as this could provide clues as to whether these potential transcripts are directly or indirectly linked to the translational readout. We compared expressed RefSeq exons and nTARs according to their relative abundance in the polysome fraction (ratios of polyribosome associated RNA/total RNA). Interestingly, we found that nTARs were present in the polyribosomal fraction at a similar level as expressed RefSeq exons in two out of three cell lines (Fig. 3A, bottom). In the HeLa S3 cell line, the nTARs were less abundant on polysomal arrays, but there was a significant overlap between the two distributions.
There are several hypotheses that could explain why nTARs are substantially represented in the polysomal fraction: (1) Some nTARs might be translated as independent protein coding units, (2) nTARs could be spliced into a coding transcript and could represent rare alternative 5′ or 3′ untranslated exons of known genes (Denoeud et al. 2007), or (3) some nTARs could result from nonspecific cross-hybridization of coding transcripts to sequences in the tiling array.
Since nTARs clearly lack identifiable ORFs (data not shown) and contain higher fractions of lower complexity sequence, it is unlikely that they represent novel protein-coding genes. To test whether nTARs are spliced either with exons of known genes or with other nTARs, we selected 45 of these sequences, both proximal and distal to genes (<10 kb and >10 kb from the 5′ end of a gene). We designed primers within the nTARs and performed 5′ and 3′ rapid amplification of cDNA ends (RACE) on both strands. PCR bands were obtained in 70% of the cases. Sequencing of RACE bands showed that in all cases the products corresponded to nonspecific amplifications with no homology with the nTAR beyond the primer region. Five control RACE experiments from known exons showed the expected target-sequence amplifications and splicing to other exons of the same gene (data not shown). These results do not support the hypothesis that nTARs are commonly spliced to nearby protein-coding genes, although if such events occurred rarely, they would not have been detected, as only a few clones per RACE reaction were sequenced.
To further investigate the RACE results, we performed RT-PCRs on an independent group of 60 nTARs selected to be representative in terms of conservation, complexity, and distance to genes. We also selected 60 expressed RefSeq exons and some nontranscribed regions as additional controls.
Out of 60 RT-PCRs performed on nTARs, 30 resulted in a band that was visible in the RT+ and absent in the RT− control (Fig. 3B), suggesting that these products were not the result of DNA contamination. On the other hand, all 60 RT-PCRs of RefSeq exons gave clear bands in the RT+ and no bands in the RT− control (Supplemental Fig. 1). Sequence analysis showed that in 26 cases the product mapped to the nTAR elements, suggesting bona fide expression; in four cases the best matching region mapped elsewhere in the genome, with an imperfect match to the nTAR location, suggesting that the signal from the array was the result of cross-hybridization (Fig. 3D).
Additional RACE experiments on the sequence-verified expressed nTARs (n = 26) gave results similar to our previous RACE data, and did not indicate any nTAR–RefSeq exons or nTAR–nTAR splicing (Fig. 3C). RT-PCR data together with the RACE results strongly suggest that a substantial proportion of nTARs is likely to result from cross-hybridization artifacts. For the nTARs that are bona fide transcriptional units, we observe no evidence of splicing (Fig. 3B).
Recent work on TARs has shown that some of these sequences are spliced to known genes or to other nearby TARs; however, since these results were obtained using nested PCR reactions, it is likely that they represent relatively rare transcriptional events, which are not detected using the standard RACE protocol (Wu et al. 2008).
We surmise that low-complexity sequences covered by the tiling array are likely to explain the high false-positive rate for the nTARs. To test this hypothesis, we selected 99 sequences equally representing three groups: (A) conserved nTARs (phastCons score > 0), (B) nTARs without low complexity DNA, (C) nTARs that contain low-complexity DNA. These sequences were tested with RT-PCR as before. We observed that group A nTARs display the lowest level of false positives (21%), group B nTARs have an intermediate false-positive rate of 30%, whereas group C nTARs, as expected, harbor the highest false-positive rates (48%). Based on the false-positive rates in different nTAR categories, we conclude that although the overall confirmation rate for nTARs is between 50% and 60%, we can define a set of high-confidence nTARs that are either conserved and/or of normal DNA complexity with high (75%) validation rates.
High-confidence nTARs are depleted from polysomal fraction
We selected the set of high-confidence nTARs to test representation in the polysomal fraction as compared with RefSeq exons. To this end, we performed a nonparametric test based on the rank change between total and polysomal fractions. We observe a significant decrease in the ranks in nTARs as compared with RefSeq exons (P < 2.2 × 10⁻¹⁶, Wilcoxon test) in all three cell lines, showing that high-confidence nTARs are significantly depleted from polysomes. This suggests that nTARs are unlikely to be involved in translation.
Post-transcriptional regulation of RefSeq exons between the cell lines
Out of 2142 expressed signals overlapping RefSeq exons in the arrays, 1280 were expressed in at least one cell line, and 602 expressed in all three cell lines. Between 6.5% and 10.8% of expressed RefSeq exons were found to be cell-type specific.
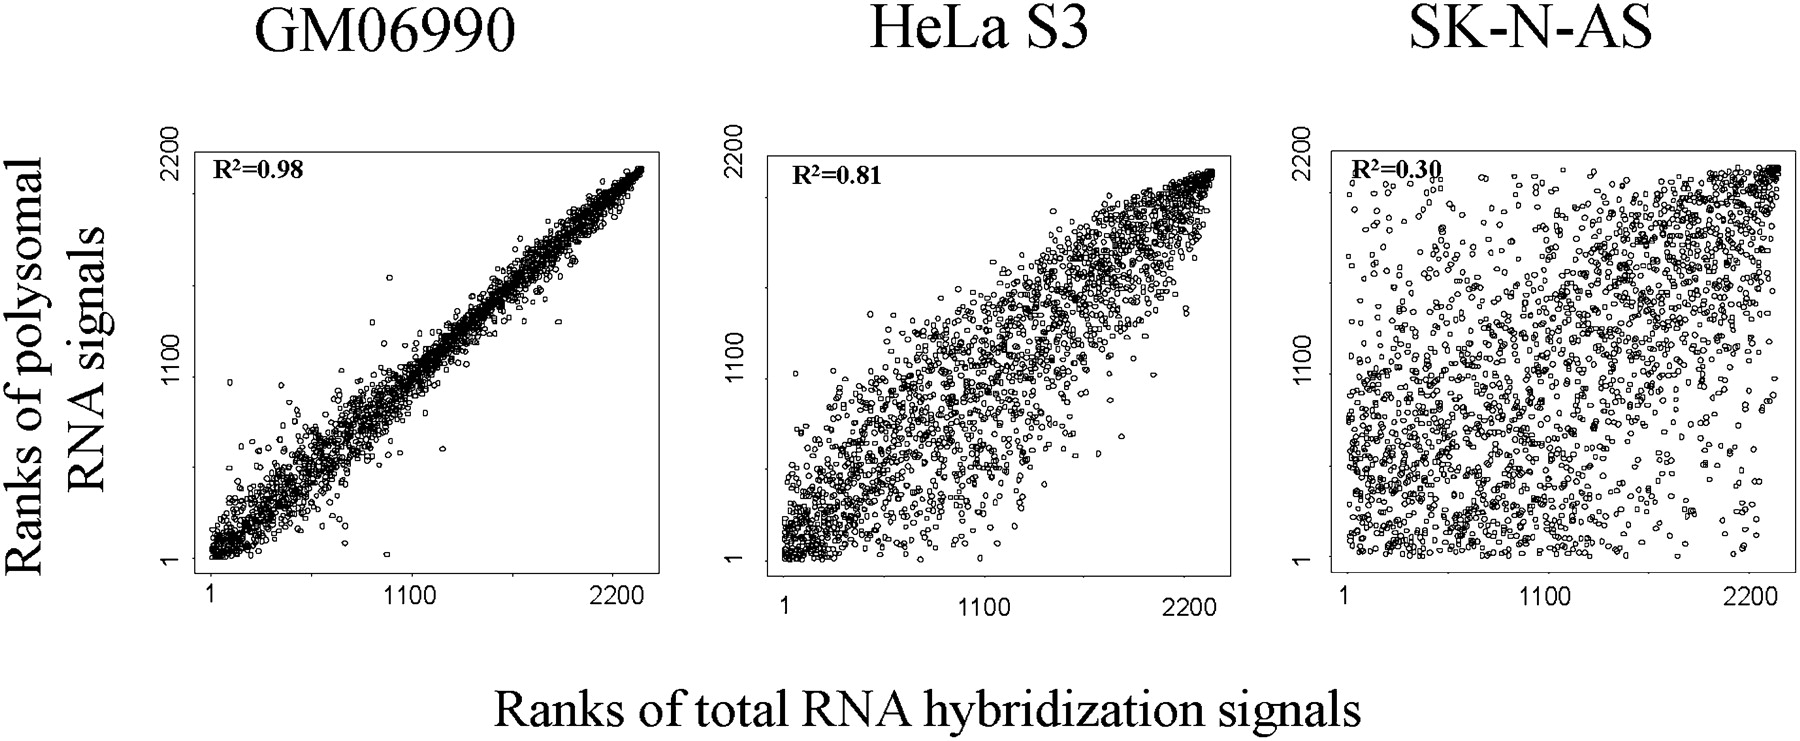
To assess post-transcriptional regulation in the three cell lines studied, we performed a nonparametric (Spearman's) rank correlation test of the signal intensities of RefSeq exons between total RNA and polysomal-associated RNAs. We hypothesized that if there is no post-transcriptional regulation, the ranking would be similar in both RNA fractions, whereas with genes that are regulated at the level of translation, the signal ranks of the exons on the polysomal-RNA array would be different from that on the total-RNA array. We observed highly significant correlations in all three cell lines. Interestingly, although the expression levels were highly concordant in the GM06990 cell line, expression ranks varied substantially between the two fractions in the SK-N-AS line, suggesting a much higher level of post-transcriptional regulation. This is consistent with previous reports showing extensive levels of post-transcriptional regulation in neuronal cells (Sakakibara et al. 1996; Schratt et al. 2004; Wang et al. 2005; Sutton and Schuman 2006). Correlation in the HeLa S3line showed intermediate levels (Fig. 4).
Nonparametric correlation of intensities between total RNA and polysome-associated RNA in three cell lines. Each dot corresponds to a RefSeq exon. R2 is a coefficient of determination.
Identification of post-transcriptionally regulated genes
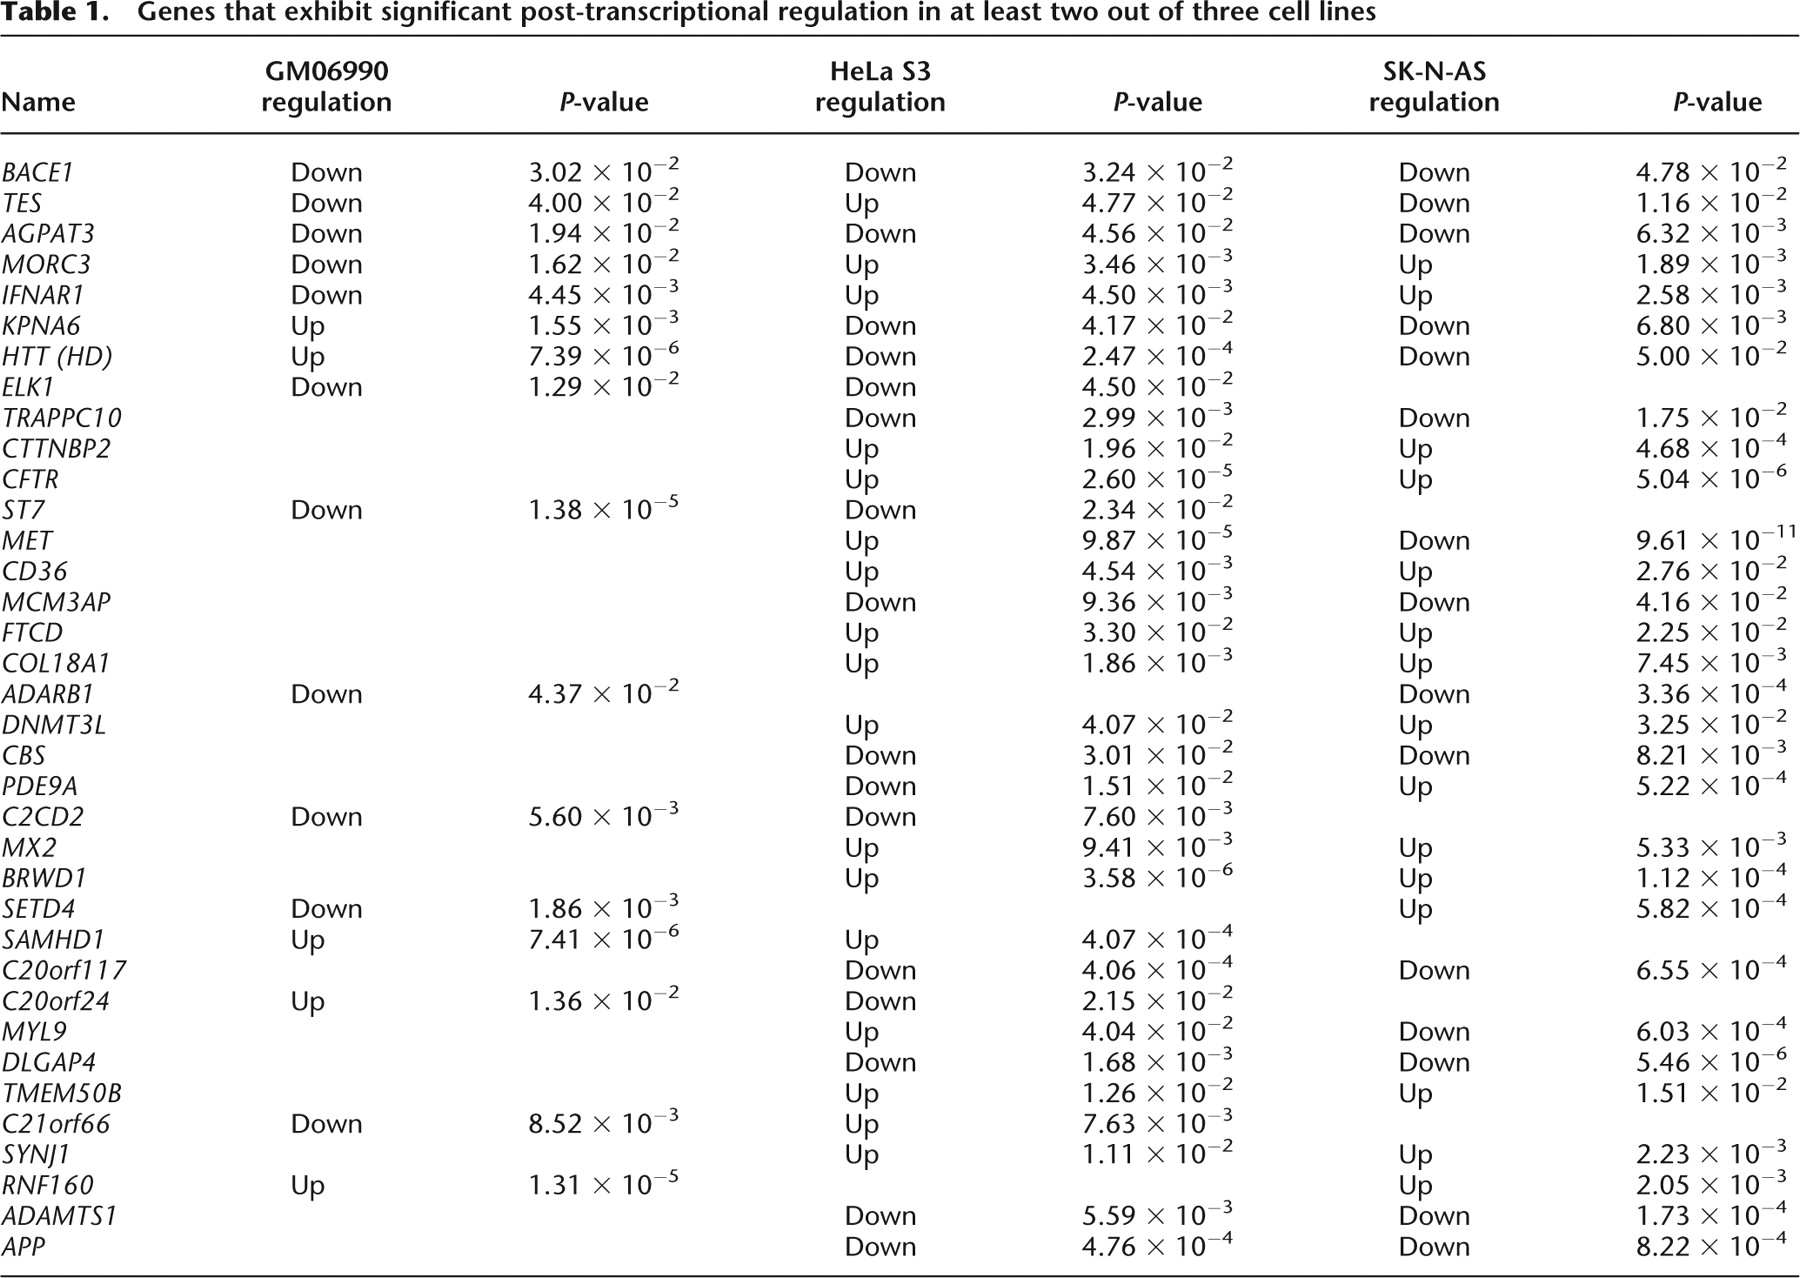
We next sought to identify protein-coding genes with significant patterns of post-transcriptional regulation. To this end, we extracted expression data from RefSeq exons in both total and polysome-associated RNA arrays, and performed nonparametric tests to identify genes with significant shifts in their polysome expression relative to total RNA expression (used as a reference). Since each cell line was hybridized once, and in order to increase the robustness of our analyses, we only considered genes that exhibited the same pattern in multiple cell lines. Out of 247 genes tested, 36 showed significantly shifted ranks between total and polysomal arrays in at least two cell lines and were selected as candidates for further characterization (Table 1). Eighteen genes were significantly post-transcriptionally down-regulated, as they were less abundant in the polysome fractions. Gene-set enrichment analysis (GSEA) using the Molecular Signatures database (MSigDB) revealed that this group of genes was significantly enriched for experimentally validated MYC target genes (P = 4.5 × 10⁻⁵) and for genes involved in Alzheimer's disease (AD) (P = 6.47 × 10⁻⁵). Particularly interesting genes included APP and the BACE1 protease that cleaves APP to produce the beta 42 peptide involved in AD pathogenesis. One could surmise that these genes are post-transcriptionally regulated to avoid the excess protein that is associated with cytotoxicity and disease. Previous independent studies have reported post-transcriptional regulation for BACE1 (Lammich et al. 2004; Mihailovich et al. 2007; Hebert et al. 2008) and APP (Rogers et al. 2002; Venti et al. 2004; Patel et al. 2008), in agreement with our data. Fifteen genes were post-transcriptionally up-regulated in at least two cell lines, and GSEA analysis revealed an enrichment for genes that respond to external signals such as viral infection (P = 5.37 × 10⁻⁵), and interferon-alpha (P = 1.8 × 10⁻⁴) (Imataka et al. 1997; Grolleau et al. 2002; Marash and Kimchi 2005).
Genes that exhibit significant post-transcriptional regulation in at least two out of three cell lines
Role of 5′ UTRs in the regulation of translational efficiency
In order to determine whether some of the post-translational regulation detected could be attributed to features within the 5′ UTR, we performed both in silico and experimental tests. First, we examined whether genes with significant patterns of post-transcriptional regulation (Table 1) had 5′ UTRs with special characteristics in terms of upstream ORF(s), upstream AUG(s), length, folding energy, and GC content, as compared with other genes present in our array. However, no significant differences could be detected (Supplemental Fig. 2). Since the number of post-transcriptionally regulated genes was quite small, it is possible that we did not have enough statistical power to detect more modest effects.
We also tested whether the 5′ UTRs of eight post-transcriptionally regulated genes, modulated translational efficiency in HeLa S3 cells, one of the lines used in the polysomal fractionation (Fig. 5). Each 5′ UTR was cloned into the pTAL-Luc vector (http://www.clontech.com/images/pt/PT3272-5.pdf) upstream of the luciferase AUG, but downstream of the HSV-TK promoter. To control for potential cryptic promoter activity within the 5′ UTRs, we generated an additional set of constructs with a HSV-TK promoter deletion. All constructs were cotransfected with a vector expressing the Renilla reporter to control for transfection differences, thus luciferase/Renilla ratios served as a measure of the translational read-out.
In vitro measurement of the 5′ UTR effect on luciferase activity in the HeLa S3 cell line. To control for cryptic promoter activity, the pTAL promoter was deleted for each 5′ UTR. The y-axis shows the luciferase/Renilla ratio.
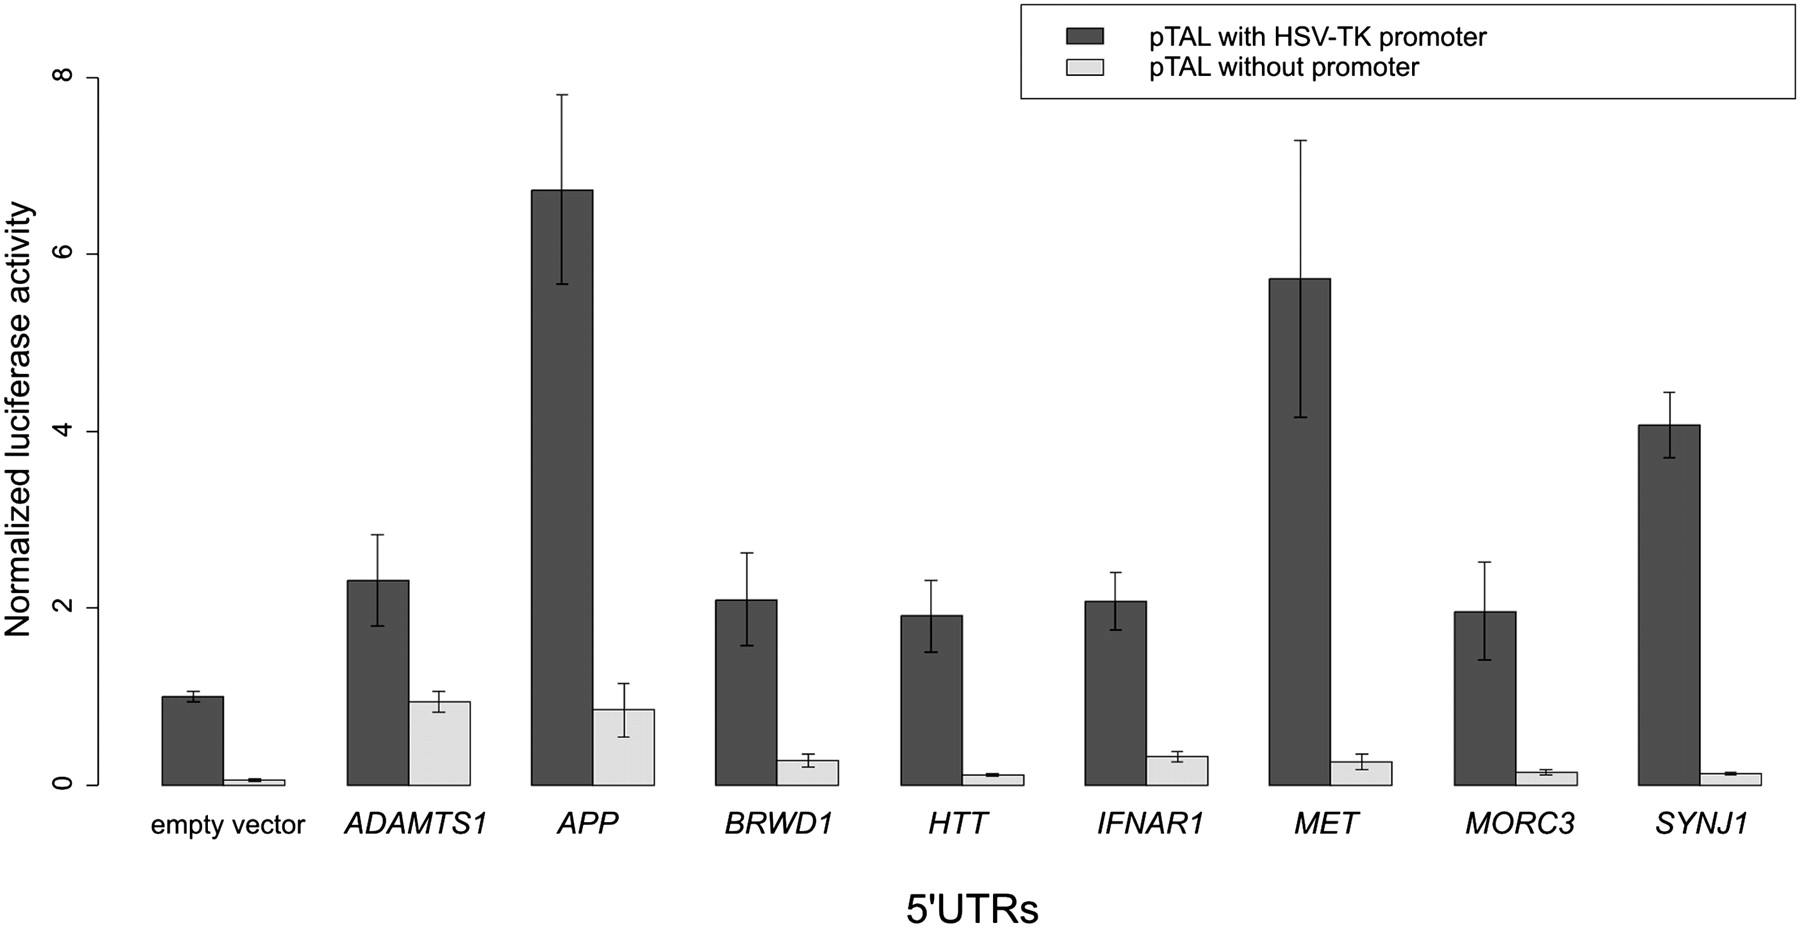
Out of these eight constructs, pTAL-ADAMTS1 and pTAL-APP were shown to have strong cryptic promoter activity, and thus post-transcriptional effects could not be unambiguously measured. For the remaining six constructs, all were shown to increase luciferase protein expression, in particular the 5′ UTRs of MET and SYNJ1, both of which were observed to be up-regulated in the polysomal fraction of HeLa S3 cells. However, the 5′ UTR of the HTT (HD) gene, which was post-transcriptionally down-regulated in the array data, also showed increased luciferase expression.
These results indicate that the relationship between translation efficiency and the 5′ UTR is not straightforward, suggesting that translational regulation is controlled by multiple interacting elements including not only the 5′ UTR but also miRNA-3′ UTR effects (Reinhart et al. 2000; Lagos-Quintana et al. 2001; Zeng et al. 2002), not studied here.
In summary, the combination of polyribosome fractionation and genomic tiling arrays is an informative tool to study the transcriptional and post-transcriptional properties of expressed elements along genomic regions. In agreement with previous data, we observed a large amount of transcriptional activity outside of annotated regions, and surprisingly, we found these nTARs to be abundant in polysomal fractions. However, the results of RACE and RT-PCR strongly suggest that one should be cautious of cross-hybridization artifacts that are likely to account for a fraction of nTARs. Bioinformatics analysis of conservation and sequence complexity allowed for the identification of a set of high-confidence nTARs. High-confidence nTARs were found to be significantly depleted from the polysomal fraction, suggesting that they are unlikely to be involved in translation. Cross-hybridization constitutes an important drawback in this technology; consequently, future studies using ultra high-throughput sequencing (Shendure et al. 2004) are likely to be very informative.
In terms of RefSeq genes, we observed that 15% of tested genes exhibited the same patterns of post-transcriptional regulation in at least two cell lines. Interestingly, a group of genes involved in neurodegenerative pathologies (APP, BACE1, HTT) was found to be strongly post-transcriptionally regulated in SK-N-AS and HeLa S3 cell lines, in agreement with previous reports. We tested whether properties within the 5′ UTR could explain some of these findings, but observed that this was not always the case, suggesting that other mechanisms, including miRNA–3′ UTR targeting, are likely to play important roles in modulating the translational read-out.
The results obtained and the conclusions of this study will provide new insights into our understanding of the molecular pathogenesis of Down syndrome, since they are likely to impact on the relationship between trisomy 21 and dosage imbalance at the protein level.
Methods
Cell culture and sample preparation
We obtained HeLa S3 and SK-N-AS cell lines from the ATCC repository, and cells were cultured according to ATCC protocols. The GM06990 lymphoblastoid cell line was obtained from the Coriell cell repository and was grown in RPMI medium supplemented with 10% FCS and 1% penicillin-streptomycin (Invitrogen).
Cells were harvested during the exponential phase (60%–80% confluence) and pelleted for 4 min at 800 rpm. The pellets were lysed for 15 min on ice in 100 mM KCl, 50 mM Tris-Cl (pH 7.4), 1.5 mM MgCl2, 1 mM DTT, 1 mg/mL heparin, 1.5% NP40, 100 mM cycloheximide, 1% aprotinin, 1 mM AEBSF, and 100 U/mL of RNasin. Nuclei were removed by centrifugation for 10 min at 12,000 rpm at 4°C.
Sucrose gradient fractionation
The supernatant was loaded on a 20%–60% sucrose gradient (in 100 mM KCl, 5 mM MgCl2, 20 mM HEPES at pH 7.4 and 2 mM DTT) and centrifuged for 3 h, 30 min at 35,000 rpm at 4°C in a Beckman SW41 rotor. Fractions were collected and UV spectroscopy profiles were determined using an ISCO programmable density gradient fractionator (www.isco.com).
RNA purification and cDNA synthesis
For the hybridization experiments we generated two pools of RNA: (1) Total RNA was prepared by taking proportional aliquots from all fractions, whereas (2) polysomal RNAs were constituted by pooling aliquots from the fractions containing two or more ribosomes as determined from the UV- profiles (Supplemental Fig. 3).
RNA was prepared by adding an equal volume of TRIzol (Invitrogen) to each pool following the instructions of the manufacturers. RNAs were isolated with RNeasy minicolumns using standard protocols (Qiagen).
Double-stranded cDNA was prepared using Superscript II and random hexamer primers (Invitrogen). RNase H and DNA polymerase I (Affymetrix) were used during second-strand synthesis. The same cDNA preps were used for real-time PCR, microarray hybridization, RT-PCR, and RACE validation experiments.
Quantitative real-time PCR analyses
To evaluate the quality of the polysome fractionation, we performed real-time quantitative PCR (qPCR) as described (Deutsch et al. 2005). Among 11 selected target genes, there were three housekeeping genes (EEF1A1, UBE2D2, AGPAT1), four genes with structured 5′ UTRs (BACE1, HTT [HD], EIF4G2, HSPA5) and four noncoding genes (MIRHG2, MALAT1, BCYRN1, MEG3). Each transcript was amplified in three replicates per sample in 384 well plates.
Raw cycle threshold (CT) values were obtained using SDS 2.1 software (Applied Biosystems). Values with a deviation of ±0.25 CT with respect to the median were considered outliers and excluded from further analysis.
Tiling array design and hybridization
Custom arrays produced by NimbleGen (http://www.nimblegen.com) were used. Probe design was performed using the repeat masked sequence of HSA21 (hg17) and the ENCODE region ENm001. In addition, 22 well-described genes comprising 17.8 Mb (16.6 Mb for HSA21, 1 Mb for the ENCODE region, and 0.2 Mb for the genes) were used as additional controls. In total, 770,000 probes, with an average length of 50 bp, were used to cover the entire region, with an average spacing of 22 bp. Hybridizations were performed using 11 ug of double-stranded cDNA per sample, after a linear amplification step for Cy3 labeling. The hybridization, washing, and scanning steps were performed using standard NimbleGen protocols.
Extraction of positive signal
Raw data from hybridization experiments were extracted using the SignalMap 1.8 software from NimbleGen. Arrays were normalized using quantile normalization. Signal intensities were converted to log2 values and smoothed between three neighboring probes using an R-based sliding window algorithm. Probes above the 99th percentile of the nonspecific bacterial probes present on the array were considered positive. A block of sequence was considered as expressed if three consecutive probes were positive. In addition, if the distance between two expressed blocks was <250 bp, they were merged into a single block. The median probe intensity within a block was used to characterize its expression level.
The level of conservation of positive signals was calculated with the phastCons17way algorithm table implemented in the UCSC Genome Browser. The phastCons program computes conservation scores based on a phylo-HMM, a type of probabilistic model that describes both the process of DNA substitution at each site in a genome and the way this process changes from one site to the next (Felsenstein and Churchill 1996; Siepel et al. 2005). Low-complexity DNA was detected using the dust program (Morgulis et al. 2006) with a parameter −10.
Analysis of polysome-associated RNA
Blocks of expressed sequence determined on the total RNA arrays were interrogated for expression using the polysomal arrays. The fraction of each RNA present in polysomal arrays was calculated as the ratio between the medians of the signals on polysomal and total arrays. The maximum ratios were adjusted to 100%, and all other values were scaled accordingly.
To identify transcripts with significant translational regulation, i.e., genes whose expression is significantly altered in polysomal arrays, we ranked all of the exons according to their signal intensities on the total and polysomal arrays and performed a nonparametric test (ranking t-tests) to compare the signal intensities of RefSeq exons from each transcript in total versus polysomal arrays. Only exons present in the majority of isoforms (core exons) were used for this analysis.
RT-PCR and RACE experiments
cDNA for RT-PCR experiments was generated using Superscript II (Invitrogen), starting from 2 ug of total RNA in a final volume of 20 μL. The cDNA was diluted 20-fold and 1 μL was used for the PCR.
For 5′ and 3′ RACE experiments, cDNA were synthesized using Superscript II (Invitrogen) and the specific SMART RACE kit (Clontech) primers according to the instructions of the manufacturers (Zhu et al. 2001). Single PCR bands were directly sequenced; when multiple bands were observed, the PCR product was cloned using the pCR 2.1-TOPO TA cloning kit (Invitrogen), and several colonies were sequenced. Coordinates of nTARs are presented in Supplemental Table 1.
In vitro characterization of the post-transcriptional effects of selected 5′ UTRs
PCR primers for the amplification of the complete 5′ UTRs of eight selected genes were designed. HindIII and NcoI sites were added at the 5′end of the primers to facilitate cloning into the pTAL firefly reporter plasmid (Clontech). These fragments were cloned between the proximal promoter and the Luciferase AUG start codon. As an additional control to test for potential cryptic promoter activity within the cloned fragments, we generated plasmids in which the pTAL luciferase promoter was deleted for each of the 5′ UTR constructs. For this, each 5′ UTR–pTAL construct was digested with XhoI and HindIII, gel purified, the ends filled-in using Klenow DNA polymerase I (Promega), and ligated with T4 Ligase, (NEB). All plasmids were sequence verified.
HeLa S3 cells were plated at a density of 104 per well in a 96-well opaque plate in DMEM containing 10% FBS (Invitrogen). Cells were grown overnight, and transient cotransfections were performed using the FuGENE HD reagent (Roche) according to the manufacturer's instructions (80 ng of pTAL firefly plasmid: 10 ng of Renilla: 0.3 μL of FuGENE HD/well). After 24 h, Firefly and Renilla luciferase assays were performed on cell lysates using the Dual-Luciferase reporter assay system (Promega) according to the manufacturer's instructions. The relative Luciferase reporter activity was obtained by normalization to the Renilla activity in order to control for differences in transfection efficiency.
Acknowledgments
This work was supported by the Lejeune Foundation grant number ME7430 to S.N., the Swiss National Science Foundation, NCCR “Frontiers in Genetics” to S.E.A. and J.D.V., La Ligue Genevoise Contre le Cancer to J.C., and the EU FP6 Integrated project AnEUploidy and Biosapiens grants to S.E.A.
References
- ↵P BertoneV StolcTE RoyceJS RozowskyAE UrbanX ZhuJL RinnW TongprasitM SamantaS Weissman(2004) Global identification of human transcribed sequences with genome tiling arrays. Science 306:2242–2246.
- ↵AH BildG YaoJT ChangQ WangA PottiD ChasseMB JoshiD HarpoleJM LancasterA Berchuck(2006) Oncogenic pathway signatures in human cancers as a guide to targeted therapies. Nature 439:353–357.
- ↵C BorelM GagnebinC GehrigEV KriventsevaEM ZdobnovSE Antonarakis(2008) Mapping of small RNAs in the human ENCODE regions. Am J Hum Genet 82:971–981.
- ↵PA CampoS DasCH HsiangT BuiCE SamuelDS Straus(2002) Translational regulation of cyclin D1 by 15-deoxy-Δ12,14-prostaglandin J2. Cell Growth Differ 13:409–420.
- ↵J ChengP KapranovJ DrenkowS DikeS BrubakerS PatelJ LongD SternH TammanaG Helt(2005) Transcriptional maps of 10 human chromosomes at 5-nucleotide resolution. Science 308:1149–1154.
- ↵F DenoeudP KapranovC UclaA FrankishR CasteloJ DrenkowJ LagardeT AliotoC ManzanoJ Chrast(2007) Prominent use of distal 5′ transcription start sites and discovery of a large number of additional exons in ENCODE regions. Genome Res 17:746–759.
- ↵ET DermitzakisA ReymondR LyleN ScamuffaC UclaS DeutschBJ StevensonV FlegelP BucherCV Jongeneel(2002) Numerous potentially functional but non-genic conserved sequences on human chromosome 21. Nature 420:578–582.
- ↵ET DermitzakisA ReymondN ScamuffaC UclaE KirknessC RossierSE Antonarakis(2003) Evolutionary discrimination of mammalian conserved non-genic sequences (CNGs) Science 302:1033–1035.
- ↵S DeutschR LyleET DermitzakisH AttarL SubrahmanyanC GehrigL ParandM GagnebinJ RougemontCV Jongeneel(2005) Gene expression variation and expression quantitative trait mapping of human chromosome 21 genes. Hum Mol Genet 14:3741–3749.
- ↵JA DrakeC BirdJ NemeshDJ ThomasC Newton-ChehA ReymondL ExcoffierH AttarSE AntonarakisET Dermitzakis(2006) Conserved noncoding sequences are selectively constrained and not mutation cold spots. Nat Genet 38:223–227.
- ↵The ENCODE Project Consortium (2007) Identification and analysis of functional elements in 1% of the human genome by the ENCODE pilot project. Nature 447:799–816.
- ↵J FelsensteinGA Churchill(1996) A hidden Markov model approach to variation among sites in rate of evolution. Mol Biol Evol 13:93–104.
- ↵M GilchristV ThorssonB LiAG RustM KorbK KennedyT HaiH BolouriA Aderem(2006) Systems biology approaches identify ATF3 as a negative regulator of Toll-like receptor 4. Nature 441:173–178.
- ↵TE GraberM Holcik(2007) Cap-independent regulation of gene expression in apoptosis. Mol Biosyst 3:825–834.
- ↵NK GrayM Wickens(1998) Control of translation initiation in animals. Annu Rev Cell Dev Biol 14:399–458.
- ↵A GrolleauJ BowmanB Pradet-BaladeE PuravsS HanashJA Garcia-SanzL Beretta(2002) Global and specific translational control by rapamycin in T cells uncovered by microarrays and proteomics. J Biol Chem 277:22175–22184.
- ↵J HarrowF DenoeudA FrankishA ReymondCK ChenJ ChrastJ LagardeJG GilbertR StoreyD Swarbreck(2006) GENCODE: Producing a reference annotation for ENCODE. Genome Biol 7:S4, 10.1186/gb-2006-7-s1-s4.
- ↵SS HebertK HorreL NicolaiAS PapadopoulouW MandemakersAN SilahtarogluS KauppinenA DelacourteB De Strooper(2008) Loss of microRNA cluster miR-29a/b-1 in sporadic Alzheimer's disease correlates with increased BACE1/β-secretase expression. Proc Natl Acad Sci 105:6415–6420.
- ↵M IaconoF MignoneG Pesole(2005) uAUG and uORFs in human and rodent 5′ untranslated mRNAs. Gene 349:97–105.
- ↵H ImatakaHS OlsenN Sonenberg(1997) A new translational regulator with homology to eukaryotic translation initiation factor 4G. EMBO J 16:817–825.
- ↵International Human Genome Sequencing Consortium (2001) Initial sequencing and analysis of the human genome. Nature 409:860–921.
- ↵International Human Genome Sequencing Consortium (2004) Finishing the euchromatic sequence of the human genome. Nature 431:931–945.
- ↵RJ Jackson(1988) RNA translation. Picornaviruses break the rules. Nature 334:292–293.
- ↵G JohannesMS CarterMB EisenPO BrownP Sarnow(1999) Identification of eukaryotic mRNAs that are translated at reduced cap binding complex eIF4F concentrations using a cDNA microarray. Proc Natl Acad Sci 96:13118–13123.
- ↵P KapranovSE CawleyJ DrenkowS BekiranovRL StrausbergSP FodorTR Gingeras(2002) Large-scale transcriptional activity in chromosomes 21 and 22. Science 296:916–919.
- ↵M Lagos-QuintanaR RauhutW LendeckelT Tuschl(2001) Identification of novel genes coding for small expressed RNAs. Science 294:853–858.
- ↵S LammichS SchobelAK ZimmerSF LichtenthalerC Haass(2004) Expression of the Alzheimer protease BACE1 is suppressed via its 5′-untranslated region. EMBO Rep 5:620–625.
- ↵S LevyG SuttonPC NgL FeukAL HalpernBP WalenzN AxelrodJ HuangEF KirknessG Denisov(2007) The diploid genome sequence of an individual human. PLoS Biol 5:e254, 10.1371/journal.pbio.0050254.
- ↵DG MacejakP Sarnow(1991) Internal initiation of translation mediated by the 5′ leader of a cellular mRNA. Nature 353:90–94.
- ↵L MarashA Kimchi(2005) DAP5 and IRES-mediated translation during programmed cell death. Cell Death Differ 12:554–562.
- ↵F MignoneC GissiS LiuniG Pesole(2002) Untranslated regions of mRNAs. Genome Biol 3:reviews0004.1–reviews0004.10.
- ↵M MihailovichR ThermannF GrohovazMW HentzeD Zacchetti(2007) Complex translational regulation of BACE1 involves upstream AUGs and stimulatory elements within the 5′ untranslated region. Nucleic Acids Res 35:2975–2985.
- ↵A MorgulisEM GertzAA SchafferR Agarwala(2006) A fast and symmetric DUST implementation to mask low-complexity DNA sequences. J Comput Biol 13:1028–1040.
- ↵K NumataY OkadaR SaitoH KiyosawaA KanaiM Tomita(2007) Comparative analysis of cis-encoded antisense RNAs in eukaryotes. Gene 392:134–141.
- ↵N PatelD HoangN MillerS AnsaloniQ HuangJT RogersJC LeeAJ Saunders(2008) MicroRNAs can regulate human APP levels. Mol Neurodegener 3:10, 10.1186/1750-1326-3-10.
- ↵SD Patterson(2003) Data analysis—the Achilles heel of proteomics. Nat Biotechnol 21:221–222.
- ↵LA PennacchioN AhituvAM MosesS PrabhakarMA NobregaM ShoukryS MinovitskyI DubchakA HoltKD Lewis(2006) In vivo enhancer analysis of human conserved non-coding sequences. Nature 444:499–502.
- ↵S PrabhakarF PoulinM ShoukryV AfzalEM RubinO CouronneLA Pennacchio(2006) Close sequence comparisons are sufficient to identify human cis-regulatory elements. Genome Res 16:855–863.
- ↵BJ ReinhartFJ SlackM BassonAE PasquinelliJC BettingerAE RougvieHR HorvitzG Ruvkun(2000) The 21-nucleotide let-7 RNA regulates developmental timing in Caenorhabditis elegans. Nature 403:901–906.
- ↵JL RinnG EuskirchenP BertoneR MartoneNM LuscombeS HartmanPM HarrisonFK NelsonP MillerM Gerstein(2003) The transcriptional activity of human Chromosome 22. Genes & Dev 17:529–540.
- ↵JT RogersJD RandallCM CahillPS EderX HuangH GunshinL LeiterJ McPheeSS SarangT Utsuki(2002) An iron-responsive element type II in the 5′-untranslated region of the Alzheimer's amyloid precursor protein transcript. J Biol Chem 277:45518–45528.
- ↵JS RozowskyD NewburgerF SaywardJ WuG JordanJO KorbelU NagalakshmiJ YangD ZhengR Guigo(2007) The DART classification of unannotated transcription within the ENCODE regions: Associating transcription with known and novel loci. Genome Res 17:732–745.
- ↵S SakakibaraT ImaiK HamaguchiM OkabeJ ArugaK NakajimaD YasutomiT NagataY KuriharaS Uesugi(1996) Mouse-Musashi-1, a neural RNA-binding protein highly enriched in the mammalian CNS stem cell. Dev Biol 176:230–242.
- ↵P Sarnow(1989) Translation of glucose-regulated protein 78/immunoglobulin heavy-chain binding protein mRNA is increased in poliovirus-infected cells at a time when cap-dependent translation of cellular mRNAs is inhibited. Proc Natl Acad Sci 86:5795–5799.
- ↵GM SchrattEA NighWG ChenL HuME Greenberg(2004) BDNF regulates the translation of a select group of mRNAs by a mammalian target of rapamycin-phosphatidylinositol 3-kinase-dependent pathway during neuronal development. J Neurosci 24:7366–7377.
- ↵KA SerikawaXL XuVL MacKayGL LawQ ZongLP ZhaoR BumgarnerDR Morris(2003) The transcriptome and its translation during recovery from cell cycle arrest in Saccharomyces cerevisiae. Mol Cell Proteomics 2:191–204.
- ↵J ShendureRD MitraC VarmaGM Church(2004) Advanced sequencing technologies: Methods and goals. Nat Rev Genet 5:335–344.
- ↵KW SherrillRE Lloyd(2008) Translation of cIAP2 mRNA is mediated exclusively by a stress-modulated ribosome shunt. Mol Cell Biol 28:2011–2022.
- ↵DD ShoemakerEE SchadtCD ArmourYD HeP Garrett-EngelePD McDonaghPM LoerchA LeonardsonPY LumG Cavet(2001) Experimental annotation of the human genome using microarray technology. Nature 409:922–927.
- ↵A SiepelG BejeranoJS PedersenAS HinrichsM HouK RosenbloomH ClawsonJ SpiethLW HillierS Richards(2005) Evolutionarily conserved elements in vertebrate, insect, worm, and yeast genomes. Genome Res 15:1034–1050.
- ↵MA SuttonEM Schuman(2006) Dendritic protein synthesis, synaptic plasticity, and memory. Cell 127:49–58.
- ↵J TingAS Lee(1988) Human gene encoding the 78,000-dalton glucose-regulated protein and its pseudogene: Structure, conservation, and regulation. DNA 7:275–286.
- ↵K TsuritaniT IrieR YamashitaY SakakibaraH WakaguriA KanaiJ Mizushima-SuganoS SuganoK NakaiY Suzuki(2007) Distinct class of putative “non-conserved” promoters in humans: Comparative studies of alternative promoters of human and mouse genes. Genome Res 17:1005–1014.
- ↵A VentiT GiordanoP EderAI BushDK LahiriNH GreigJT Rogers(2004) The integrated role of desferrioxamine and phenserine targeted to an iron-responsive element in the APP-mRNA 5′-untranslated region. Ann N Y Acad Sci 1035:34–48.
- ↵H WangA IacoangeliD LinK WilliamsRB DenmanCU HellenH Tiedge(2005) Dendritic BC1 RNA in translational control mechanisms. J Cell Biol 171:811–821.
- ↵RH WaterstonK Lindblad-TohE BirneyJ RogersJF AbrilP AgarwalR AgarwalaR AinscoughM AlexanderssonP An(2002) Initial sequencing and comparative analysis of the mouse genome. Nature 420:520–562.
- ↵M WickensP AndersonRJ Jackson(1997) Life and death in the cytoplasm: Messages from the 3′ end. Curr Opin Genet Dev 7:220–232.
- ↵MR WilkinsRD AppelJE Van EykMC ChungA GorgM HeckerLA HuberH LangenAJ LinkYK Paik(2006) Guidelines for the next 10 years of proteomics. Proteomics 6:4–8.
- ↵JQ WuJ DuJ RozowskyZ ZhangAE UrbanG EuskirchenS WeissmanM GersteinM Snyder(2008) Systematic analysis of transcribed loci in ENCODE regions using RACE sequencing reveals extensive transcription in the human genome. Genome Biol 9:R3, 10.1186/gb-2008-9-1-r3.
- ↵Y ZengEJ WagnerBR Cullen(2002) Both natural and designed micro RNAs can inhibit the expression of cognate mRNAs when expressed in human cells. Mol Cell 9:1327–1333.
- ↵YY ZhuEM MachlederA ChenchikR LiPD Siebert(2001) Reverse transcriptase template switching: A SMART approach for full-length cDNA library construction. Biotechniques 30:892–897.
Notes
[1] [Supplemental material is available online at www.genome.org. The microarray data from this study have been submitted to ArrayExpress (http://www.ebi.ac.uk/microarray-as/ae/) under accession nos. A-MEXP-1600 and A-MEXP-1601, and to http://home.adm.unige.ch/~nikolaev/Polysome_array_data.rar.]
[2] Article published online before print. Article and publication date are at http://www.genome.org/cgi/doi/10.1101/gr.089425.108.