Abstract
When the temperature and viscosity of the solvent is held constant, the degree of fluorescence polarization (FP) detected when a fluorescent dye is excited by plane polarized light depends mostly on the molecular weight of the dye molecule. By monitoring the FP of a fluorescent dye molecule, one can detect significant changes in the molecular weight of a fluorescent molecule without separation or purification. The 5′-nuclease (TaqMan) assay is a robust single nucleotide polymorphism genotyping method where an allele-specific probe that binds to a perfectly complementary target is cleaved by the 5′-nuclease activity of Taq DNA polymerase. Because the TaqMan probe is labeled with a fluorescent dye, it has high FP value when intact but a low FP value after cleavage. In this study, we compared the results of the 5′-nuclease assay based on standard fluorescence intensity readings and FP readings when genotyping 90 individuals with 20 single nucleotide polymorphisms. Our results show that FP is just as robust and reliable as the standard fluorescence detection method. Use of FP detection makes it possible to reduce the cost of TaqMan probes by abrogating the need for a fluorescence quencher.
The ability to determine efficiently and unambiguously the mutational status or genotype of an organism has great applications in molecular diagnostics, clinical genetic testing, population genetics, and agricultural biotechnology. High-throughput genotyping methods for single nucleotide variations currently in use discriminate between the alleles by differential hybridization, primer extension, ligation, and allele-specific cleavage of a probe (Kwok 2000). Homogeneous assays based on these allele discrimination mechanisms are conducted in aqueous solutions without separation or purification by monitoring physical changes when the reagents are turned into products. We have shown previously that fluorescence polarization (FP) is a good detection method in the primer extension assay when a dye-labeled dideoxy terminator is incorporated allele-specifically in the presence of a matching DNA template (Chen et al. 1999). In this report, we show that FP also is a good detection method for the 5′-nuclease (TaqMan) assay, where a fluorescent probe is cleaved during the polymerase chain reaction only when it is annealed to a perfectly complementary template.
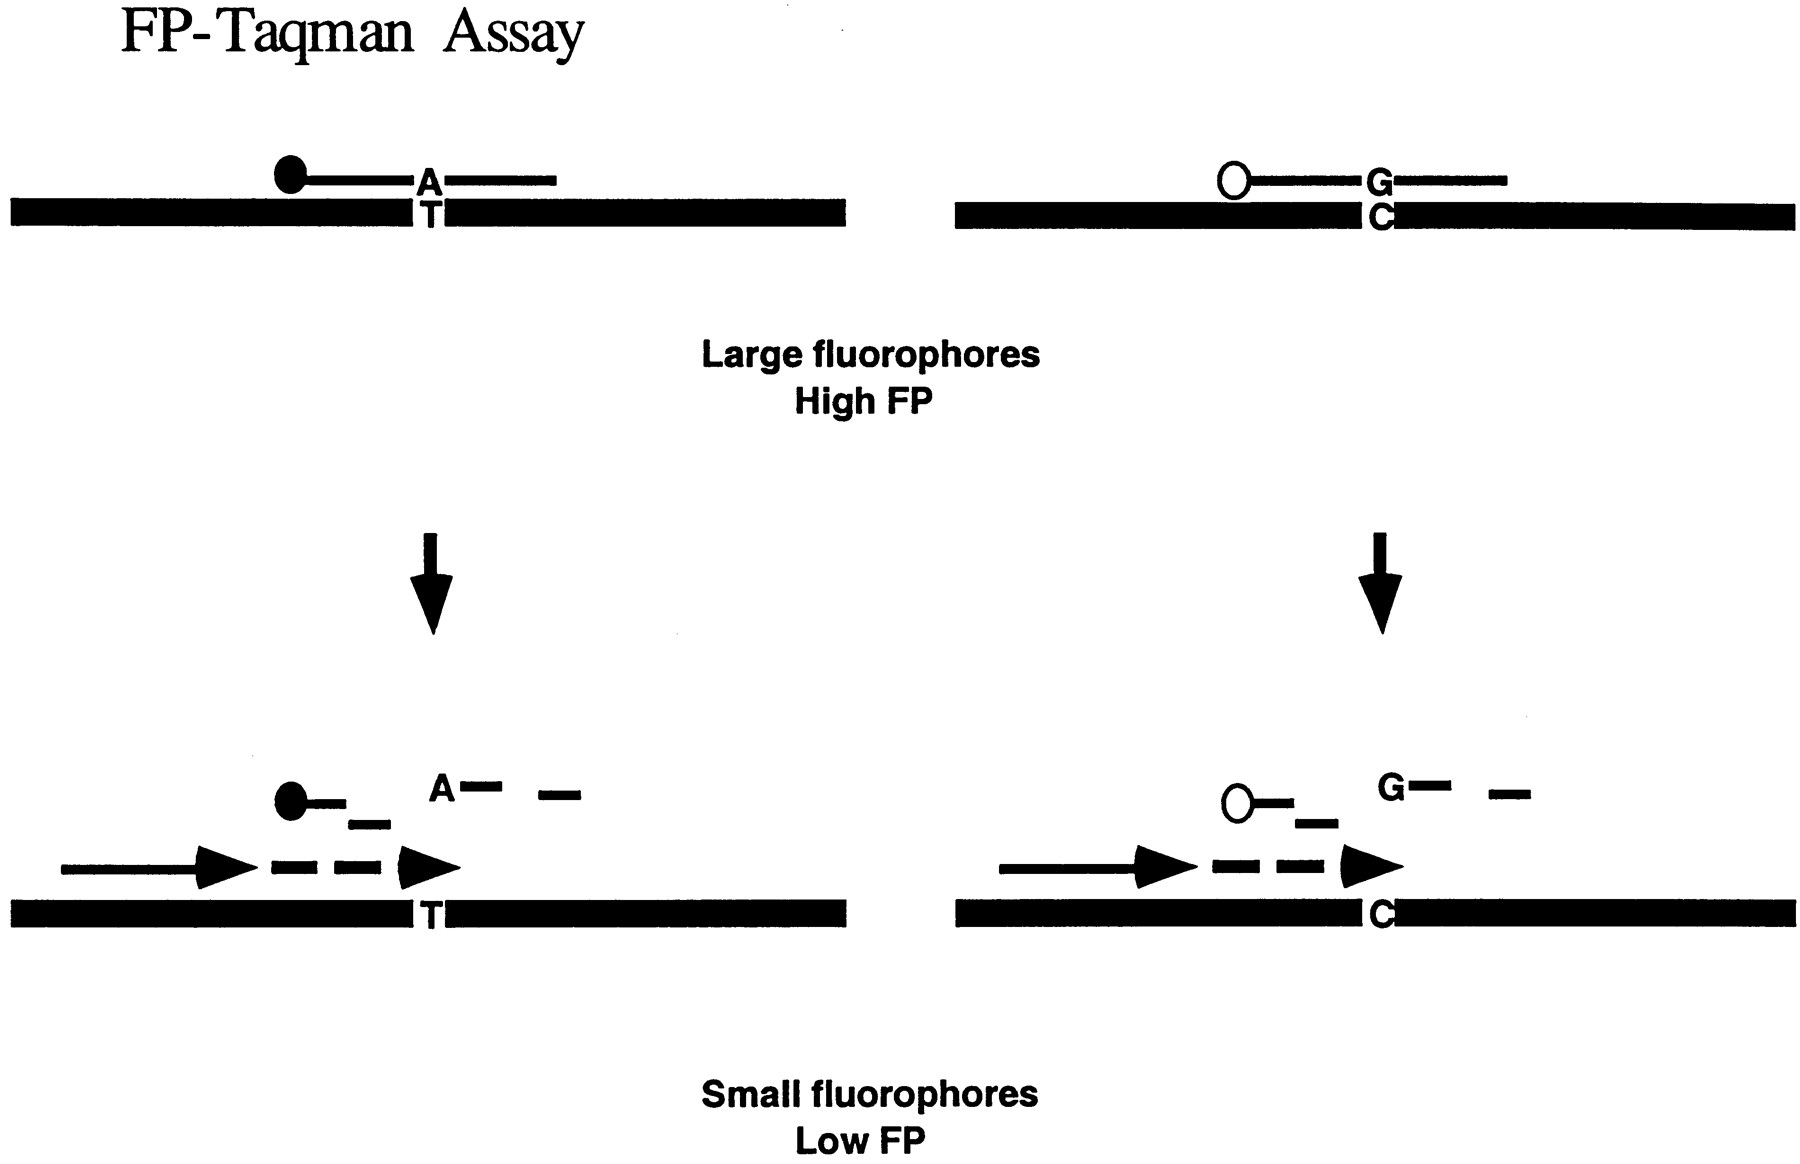
When a fluorescent molecule is excited by plane-polarized light at the correct wavelength, the fluorescence emitted is also polarized. However, because the molecule rotates and tumbles in space, the FP observed is proportional to the fluorescent molecule's rotational relaxation time (the time it takes to rotate through an angle of 68.5°), which is related to the viscosity of the solvent, absolute temperature, molecular volume, and the gas constant. Therefore, if the viscosity and temperature are constant, FP is directly proportional to the molecular volume, which is directly proportional to molecular weight. If the fluorescent molecule is large (with high molecular weight), it rotates and tumbles more slowly in space and FP is preserved. If the molecule is small (with low molecular weight), it rotates and tumbles faster and FP is largely lost or depolarized. In principle, FP can be used to detect any significant change in molecular weight of a fluorescent molecule. Indeed, FP detection is the basis of numerous clinical and research assays, especially those involved in ligand-receptor binding (Checovich et al. 1995).
The 5′-nuclease assay is one of the simplest diagnostic assays by which one can determine the mutational status of a DNA sample in one step (Livak 1999). The current detection method in the 5′-nuclease assay relies on the increase in fluorescence intensity when a reporter fluorophore is released from its quencher as the doubly labeled probe is cleaved during PCR (Lee et al. 1999). Because the 5′-nuclease assay is one where a large probe is cleaved into small molecules, we reason that FP can be a good detection system for the method (Fig.1).
To show that FP detection is indeed suitable for the 5′-nuclease assay, we performed the assay with 20 markers on DNA samples from 90 individuals. At the end of the assay, detection and analysis was done by both fluorescence intensity and FP. We report here that both fluorescence intensity and FP gave completely concordant genotypes.
RESULTS
Twenty markers, previously optimized for the 5′-nuclease assay, were used in this study (Table 1). The two allele-specific probes were labeled with reporter dyes VIC (allele 1) and FAM (allele 2), respectively, and contain a nonfluorescent quencher. In addition, the probes also are fitted with a minor groove binder to keep the probe length to a minimum and maximize the effect of the one-base mismatch (Kutyavin et al. 1997; Afonina et al. 1997). Genomic DNA samples of 90 individuals selected from the National Institutes of Health (NIH) Polymorphism Discovery Panel (Collins et al. 1998) were typed for each marker. Six water blanks served as the negative controls. For all 20 sets of experiments (1920 independent genotyping experiments), the fluorescence intensity readings and FP readings at the end of the experiments clustered into four distinct groups (Fig. 2), representing the four possible outcomes of each genotyping experiment. Figure 2a shows the normalized fluorescence intensities of the individual samples at the end of the assay for marker D2S1301, an anonymous single nucleotide polymorphism (SNP) marker developed in our laboratory (Kwok et al. 1996). For the negative controls, both probes remain intact at the end of the reaction and the fluorescence of the reporters is quenched. The data points for the negative controls therefore occupy the region near the origin of the scatter plot, where the fluorescence intensities of both VIC and FAM are low. For the samples homozygous for allele 1, the VIC probe is cleaved but the FAM probe remains intact. They are found in the lower right corner of the plot, where VIC fluorescence is high but FAM fluorescence is low. Similarly, homozygotes with allele 2 occupy the upper left corner of the plot, where FAM fluorescence is high but VIC fluorescence is low. For the heterozygotes, both probes are cleaved and they occupy the upper right corner of the plot, where both VIC and FAM fluorescence are high.
PCR Primer and TaqMan Probe Sequences for SNP Markers Studied
| Marker | NCBI assay ID | Allele 1 | Allele 2 | Allele 1 (VIC) TaqMan probe | Allele 2 (FAM) TaqMan probe | PCR Primer 1 | PCR Primer 2 |
| D4S2341 | 231 | C | G | VIC-ccatgGgttagccaa-NFQ-MGB | FAM-ccatgCgttagcc-NFQ-MGB | GAGGTTTCACTGGCTTGTGCT | CATGAGACATTTATCTAATGATTTTTTCTTATT |
| D10S1188 | 241 | A | C | VIC-tgtaccacTctttttc-NFQ-MGB | FAM-taccacGctttttc-NFQ-MGB | TGCTGAATTTCCATCTCTGAGTTC | GCAGGATTCAGTGCCAGAAAG |
| D2S1301 | 221 | A | G | VIC-ttcatctccAtttgtg-NFQ-MGB | FAM-tttcatctccGtttgtg-NFQ-MGB | CCCCAGTATCTGGCACATC | TTTCTCAGGTTTCAGGGATTAGA |
| D11S1964 | 245 | del | T | VIC-caccccaatagca-NFQ-MGB | FAM-caccccTaatagca-NFQ-MGB | TAAAGATGTTGGAGAACTGAAAAAGA | GACCACGGAAGGACACATACAT |
| D7S8 | 870137 | C | T | VIC-ctttccCggaatgc-NFQ-MGB | FAM-cctttccTggaatgc-NFQ-MGB | CTCAGGGACCCTGACCTTATTG | GCCTTCTCAGAGCTTATATTATTGTGTC |
| D10S1257 | 243 | T | C | VIC-tgctgttcTtctgcc-NFQ-MGB | FAM-tgttcCtctgcctcc-NFQ-MGB | CCCCAGGCTGCACAGAAC | TCCTTGAGCCTAAGAGATAGGGC |
| WIAF1177 | 686 | T | C | VIC-cccAaagaaaaca-NFQ-MGB | FAM-cccGaagaaaacaa-NFQ-MGB | TGGGGCTTGACTTTCCAA | CAAATGCCTAATAGACACTATTGGTAGAT |
| WIAF1100 | 667 | G | A | VIC-cctacttacGatcctgg-NFQ-MGB | FAM-cctacttacAatcctgg-NFQ-MGB | TGTGGGACCTGAGCACTTTT | GACCACGCTAAACCCAAATACA |
| WIAF1244 | 693 | T | C | VIC-ccccAttgacatcg-NFQ-MGB | FAM-ccccGttgacatc-NFQ-MGB | TCCAAACTTCACTCCATCTCAA | GGGCCAGCCTCTTTTCAT |
| WIAF1296 | 701 | G | A | VIC-actgcctGgcccaa-NFQ-MGB | FAM-actgcctAgcccaaa-NFQ-MGB | AAAAGAAGAAAAAATTTAAAGGGTGTACTTATA | AATGAGGGCTGATCCTACCAC |
| WIAF1430 | 674 | G | A | VIC-ctccagagGtcaagtc-NFQ-MGB | FAM-ctccagagAtcaagtc-NFQ-MGB | GGTCCTCTTTGCTCCTAACATCTAT | TCAAGTAATCACTCACCAGTGTTGA |
| WIAF1504 | 3188 | A | G | VIC-tggctTatactgccc-NFQ-MGB | FAM-tggctCatactgcc-NFQ-MGB | CCGGCTGATTTTCTTCGACA | CCTAGGCCTCATCTGTGGGAA |
| WIAF1842 | 3388 | A | G | VIC-ccattTgttacatttc-NFQ-MGB | FAM-cattCgttacatttca-NFQ-MGB | CATTCTGGTTTTGACATCAGCATT | GCAAAAGGTGCCATGGTGTT |
| WIAF1634 | 2043 | C | T | VIC-aagattGacaattcc-NFQ-MGB | FAM-agaagattAacaattcc-NFQ-MGB | AGGTATTTGAACTTCATTATCTTCAGC | ACATCAATTGAGCTAATGCAAGAA |
| WIAF1761 | 3308 | G | A | VIC-agcCctgttccctt-NFQ-MGB | FAM-cagcTctgttccctt-NFQ-MGB | GATGGTGGAAGCAGCATGAAA | CTGAGGGTGGCGTCTTTAGAGA |
| WIAF2081 | 1194 | T | C | VIC-cacatcaTgtatgcaatg-NFQ-MGB | FAM-cacatcaCgtatgcaa-NFQ-MGB | GCAGATCAGTCAGCCCACTT | CCCCATCCTACCAGTTGGT |
| WIAF2117 | 1230 | C | T | VIC-cctcaCagtctctct-NFQ-MGB | FAM-cctcaTagtctctctc-NFQ-MGB | CCCTTGGCTCCTCCACTT | ACCACCAGTAGCCATCTTGTTT |
| WIAF2188 | 3596 | G | A | VIC-aacacaGaaacccagcc-NFQ-MGB | FAM-aacacaAaaacccagcc-NFQ-MGB | CATGCCCGAATTTAGATGCT | AGAGCTCAGCGTGCTAGTCAT |
| WIAF270 | 2619 | G | A | VIC-atgccCcaagcag-NFQ-MGB | FAM-tgccTcaagcagc-NFQ-MGB | GGCAAAGAACAGAAGTAAAATCCAGAA | CAGTTTCACAGTGAAAGTTGGCAA |
| WIAF2072 | 1185 | G | A | VIC-caccattagGtcctg-NFQ-MGB | FAM-caccattagAtcctg-NFQ-MGB | GAAACGCATCTCACTGTCATTCTATT | CACCATACTTCATGGCAAGGACT |
[i] Some of TaqMan probes were designed for the antisense sequence (NCBI Assay ID ⧣231, 241, 686, 693, 3188, 3388, 2043, 3308, and 2619). The bases under the Allele 1 and Allele 2 columns were those reported in the dbSNP entries.
Scatter plot of the results of 5′-nuclease assay with marker D2S1301 on 90 individuals. (A) Fluorescence intensity analysis. (B) Normalized fluorescence polarization analysis.

Figure 2b shows the results of the FP analysis of marker D2S1301. The positive reactions in this case give low FP values (as opposed to high fluorescence intensity values). For the negative controls, both probes remain intact at the end of the reaction and the FP values of both reporters remain high. Therefore, the data points for the negative controls occupy the upper right corner of the scatter plot. For the samples homozygous for allele 1, the VIC probe is cleaved but the FAM probe remains intact. They are found in the lower right corner of the plot, where VIC FP is low but FAM FP is high. Similarly, homozygotes with allele 2 occupy the upper left corner of the plot, where FAM FP is low but VIC FP is high. For the heterozygotes, both probes are cleaved and they occupy the origin of the plot, where both VIC and FAM FP values are low.
Semi-automated genotype assignments are made by taking the ratio between the normalized FP values of VIC and FAM. A sample with a low VIC/FAM ratio represents a homozygous allele 1 sample (cleaved VIC probe, intact FAM probe); a high VIC/FAM ratio represents a homozygous allele 2 sample (intact VIC probe, cleaved FAM probe); a VIC/FAM ratio close to one represents a heterozygote if the absolute FP values of both VIC and FAM are low (both probes are cleaved) but a negative control (or failed PCR) if the absolute FP values of both dyes are high (both probes are intact). Table 2 shows the genotype assignments of 24 DNA samples and six negative controls for marker D2S1301. All genotypes generated by this study have been deposited in dbSNP.
5′-Nuclease Assay Results for Marker D2S1301 Detected by FP Changes
| Sample | Normalized FAM | Normalized VIC | VIC/FAM | GENOTYPE |
| PD0001 | 11.2 | 8.8 | 0.8 | 1,2 |
| PD0002 | 5.2 | 80.3 | 15.4 | 2 |
| PD0003 | 8.8 | 80.2 | 9.1 | 2 |
| PD0004 | 8.2 | 74.8 | 9.1 | 2 |
| PD0005 | 14.8 | 12.1 | 0.8 | 1,2 |
| PD0006 | 18.3 | 19 | 1 | 1,2 |
| PD0007 | 17.8 | 13 | 0.7 | 1,2 |
| PD0008 | 22.7 | 15.1 | 0.7 | 1,2 |
| PD0009 | 11.8 | 74.7 | 6.3 | 2 |
| PD0010 | 8.2 | 73.8 | 9 | 2 |
| PD0011 | 6.8 | 74 | 10.9 | 2 |
| Neg Ctrl | 242.6 | 128.7 | 0.5 | 0 |
| PD0012 | 11.8 | 79 | 6.7 | 2 |
| PD0013 | 20.8 | 14.8 | 0.7 | 1,2 |
| PD0014 | 21.4 | 14.3 | 0.7 | 1,2 |
| PD0015 | 20.5 | 11.6 | 0.6 | 1,2 |
| PD0016 | 3.8 | 74.5 | 19.6 | 2 |
| PD0017 | 7.4 | 74.9 | 10.1 | 2 |
| PD0018 | 6.6 | 75.7 | 11.5 | 2 |
| PD0019 | 11.5 | 74.7 | 6.5 | 2 |
| PD0020 | 31.8 | 19.7 | 0.6 | 1,2 |
| PD0021 | 6.8 | 74.3 | 10.9 | 2 |
| PD0022 | 82.7 | 6.3 | 0.1 | 1 |
| PD0023 | 19.2 | 14.4 | 0.8 | 1,2 |
| PD0024 | 22.4 | 12.6 | 0.6 | 1,2 |
| Neg Ctrl | 245 | 128.5 | 0.5 | 0 |
| PD0025 | 23.8 | 13.7 | 0.6 | 1,2 |
| PD0026 | 23 | 13.2 | 0.6 | 1,2 |
| PD0027 | 23.3 | 13.3 | 0.6 | 1,2 |
| PD0028 | 91.4 | 5.8 | 0.1 | 1 |
[i] The results of the first 30 samples of the experiment are shown.
The genotypes called, based on fluorescence intensity readings and FP readings, are compared for all 20 markers (1800 samples total). Table3 shows the concordance rate of these experiments. All 20 sets of experiments worked the first time, with only three samples where the genotypes could not be called with high confidence (because of weak PCR amplification). When the genotyping assays were redone for the three failed samples, all gave unambiguous and concordant genotypes. In this study, the concordance rate between the fluorescence intensity analysis and FP analysis of the 5′-nuclease assay was 100%.
Concordance Rate of Genotypes Called by FRET or FP Reading of the 5′-Nuclease Assay for 20 Markers
| Marker | No. of samples tested | No. of PCR failures | No. of confident calls | Percent concordance |
| D4S2341 | 90 | 0 | 90 | 100 |
| D10S1188 | 90 | 1 | 89 | 100 |
| D4S1301 | 90 | 0 | 90 | 100 |
| D111964 | 90 | 0 | 88 | 100 |
| D7S8 | 90 | 0 | 90 | 100 |
| D10S1257 | 90 | 0 | 90 | 100 |
| WIAF1177 | 90 | 0 | 90 | 100 |
| WIAF1100 | 90 | 0 | 90 | 100 |
| WIAF1244 | 90 | 0 | 90 | 100 |
| WIAF1296 | 90 | 0 | 90 | 100 |
| WIAF1430 | 90 | 1 | 89 | 100 |
| WIAF1504 | 90 | 0 | 90 | 100 |
| WIAF1842 | 90 | 0 | 90 | 100 |
| WIAF1634 | 90 | 0 | 90 | 100 |
| WIAF1761 | 90 | 1 | 89 | 100 |
| WIAF2081 | 90 | 0 | 90 | 100 |
| WIAF2117 | 90 | 0 | 90 | 100 |
| WIAF2188 | 90 | 0 | 89 | 100 |
| WIAF270 | 90 | 0 | 90 | 100 |
| WIAF2072 | 90 | 0 | 89 | 100 |
DISCUSSION
The 5′-nuclease assay is a proven method for the detection of SNPs. In our hands, the 20 markers performed beautifully the first time under a universal set of conditions. In the current configuration, a modified probe containing a fluorescent reporter, a quencher, and a minor groove binder is required for each allele. The use of FP as a detection method opens up the possibility of utilizing a somewhat less costly probe (at least 10%–15% cheaper) without the need for the quencher to be present. In addition, FP detection works best when the cleavage reaction is driven to completion and makes it possible to use a limiting amount of the modified probes, thereby reducing the cost of the reaction even further. Whereas the FP plate reader is comparable in cost to the TaqMan plate reader, the throughput is four times higher because it can read 384 reactions in five minutes. If dyes compatible with FP detection can be found across the visible/infrared spectrum, a moderate level of multiplexing (up to 20 alleles, or 10 SNP markers) can be achieved. With the proof-of-principle accomplished, work is under way to design allele-specific probes without the quencher to develop 5′-nuclease assays for FP analysis. One-step, robust assays requiring minimal handling are the methods of choice in DNA diagnostics. The FP-TaqMan assay, with reduced setup and operating costs, will make DNA diagnostics more accessible to the average laboratory.
METHODS
Source of DNA
DNA samples from 90 individuals of the NIH Polymorphism Discovery Panel (PD0001-PD0090) were used in this study.
PCR Amplification
Genomic DNA was amplified in a 25 μL volume using the 5′-nuclease assay kit (PE Biosystems) according to the manufacturer's instructions either on a PE Biosystems 7700 Sequence Detector or on a PE Biosystems 9600 GeneAmp PCR machine. Briefly, the reaction mixture contained 4 ng of genomic DNA, 900 nM each PCR primer, 200 nM each probe, and TaqMan Universal PCR Master Mix (contains AmpErase UNG and AmpliTaq Gold enzymes, dNTPs, and reaction buffer; Applied Biosystems P/N 4304437). TaqMan MGB probes labeled with 6-FAM or VIC (Applied Biosystems P/N 4316033) were used. The reaction mixture was incubated at 50°C for 2 min for AmpErase UNG degradation of any carryover DNA contamination followed by AmpliTaq Gold enzyme activation at 95°C for 10 min before 35 amplification cycles were performed. Each cycle consisted of denaturation at 92°C for 15 sec followed by annealing and primer extension at 60°C for 1 min.
Data Analysis
End-Point Fluorescence Intensity Analysis
The fluorescence intensity of the reaction mixtures was read on the Applied Biosystems 7700 sequence detector using Sequence Detector v1.7 software. The genotypes were called semi-automatically (Livak 1999).
Fluorescence Polarization Analysis
To each reaction well was added 50 μL of FP reading buffer (50 mM Tris-HCl (pH 9.0), 50 mM KCl, 5 mM MgCl2, 8% glycerol, 0.1% Triton X-100) and 25 μL of ethanol. The FP values were determined on a LJL Biosystems (now Molecular Devices) Analyst plate reader. The VIC and FAM dyes were excited at 520 nm and 485 nm and read at 550 nm and 530 nm, respectively, according to the manufacturer's instructions. The FP readings were exported to a spreadsheet and graphed as a scatter plot. The FP readings were normalized by performing two steps: First, the background FP for each dye was subtracted such that the sample with the lowest VIC reading among all samples was given a value of 1 for VIC and that with the lowest FAM reading was given a value of 1 for FAM; next, the scales of both dyes were equalized by multiplying the FAM FP values by a constant such that the average value of the cluster in the upper left corner was the same as that of the cluster in the lower right corner. The ratios of the normalized VIC and FAM FP values were determined and genotypes were assigned as follows: VIC/FAM <0.2 = allele 1 homozygote; VIC/FAM >5 = allele 2 homozygote; VIC/FAM >0.5 and <3 = heterozygote (if ‖VIC‖ and ‖FAM‖ FP <15) or negative control/failed PCR (if ‖VIC‖ and ‖FAM‖ FP >60).
This work is supported in part by a grant from the National Institutes of Health (EY12557) to PYK. S.L. is a recipient of a Howard Hughes Medical Institute summer research fellowship. We thank S. Miller for informatics help.
The publication costs of this article were defrayed in part by payment of page charges. This article must therefore be hereby marked “advertisement” in accordance with 18 USC section 1734 solely to indicate this fact.
Notes
[3] These authors contributed equally to this work.
[4] Corresponding author.
Notes
[5] E-MAIL [email protected]; FAX (314) 362-8159.
[6] Article and publication are at www.genome.org/cgi/doi/10.1101/gr.156601
REFERENCES
- ↵I. AfoninaM. ZivartsI. KutyavinE. LukhtanovH. GamperR.B. Meyer(1997) Efficient priming of PCR with short oligonucleotides conjugated to a minor groove binder. Nucleic Acids Res. 25:2657–2660.
- ↵W.J. ChecovichR.E. BolgerT. Burke(1995) Fluorescence polarization: A new tool for cell and molecular biology. Nature 375:254–256.
- X. ChenB. ZehnbauerA. GnirkeP.-Y. Kwok(1997) Fluorescence energy transfer detection as a homogeneous DNA diagnostic method. Proc. Natl. Acad. Sci. 94:10756–10761.
- ↵X. ChenL. LevineP.-Y. Kwok(1999) Fluorescence polarization in homogeneous nucleic acid analysis. Genome Res. 9:492–498.
- ↵F.S. CollinsL.D. BrooksA. Chakravarti(1998) A DNA polymorphism discovery resource for research on human genetic variation. Genome Res. 8:1229–1231.
- ↵I.V. KutyavinE.A. LukhtanovH.B. GamperR.B. Meyer(1997) Oligonucleotides with conjugated dihydropyrroloindole tripeptides: Base composition and backbone effects on hybridization. Nucleic Acids Res. 25:3718–3723.
- ↵P.-Y. KwokQ. DengH. ZakeriD.A. Nickerson(1996) Increasing the information content of STS-based genome maps: Identifying polymorphisms in mapped STSs. Genomics 31:123–126.
- ↵P.-Y. Kwok(2000) High-throughput genotyping assay approaches. Pharmacogenomics 1:95–100.
- ↵L.G. LeeK.J. LivakB. MullahR.J. GrahamR.S. VinayakT.M. Woudenberg(1999) Seven-color, homogeneous detection of six PCR products. Biotechniques 27:342–349.
- ↵K.J. Livak(1999) Allelic discrimination using fluorogenic probes and the 5′ nuclease assay. Genet Anal. 14:143–149.
- K.J. LivakJ. MarmaroJ.A.. Todd(1995) Towards fully automated genome-wide polymorphism screening. Nature Genet. 9:341–342.