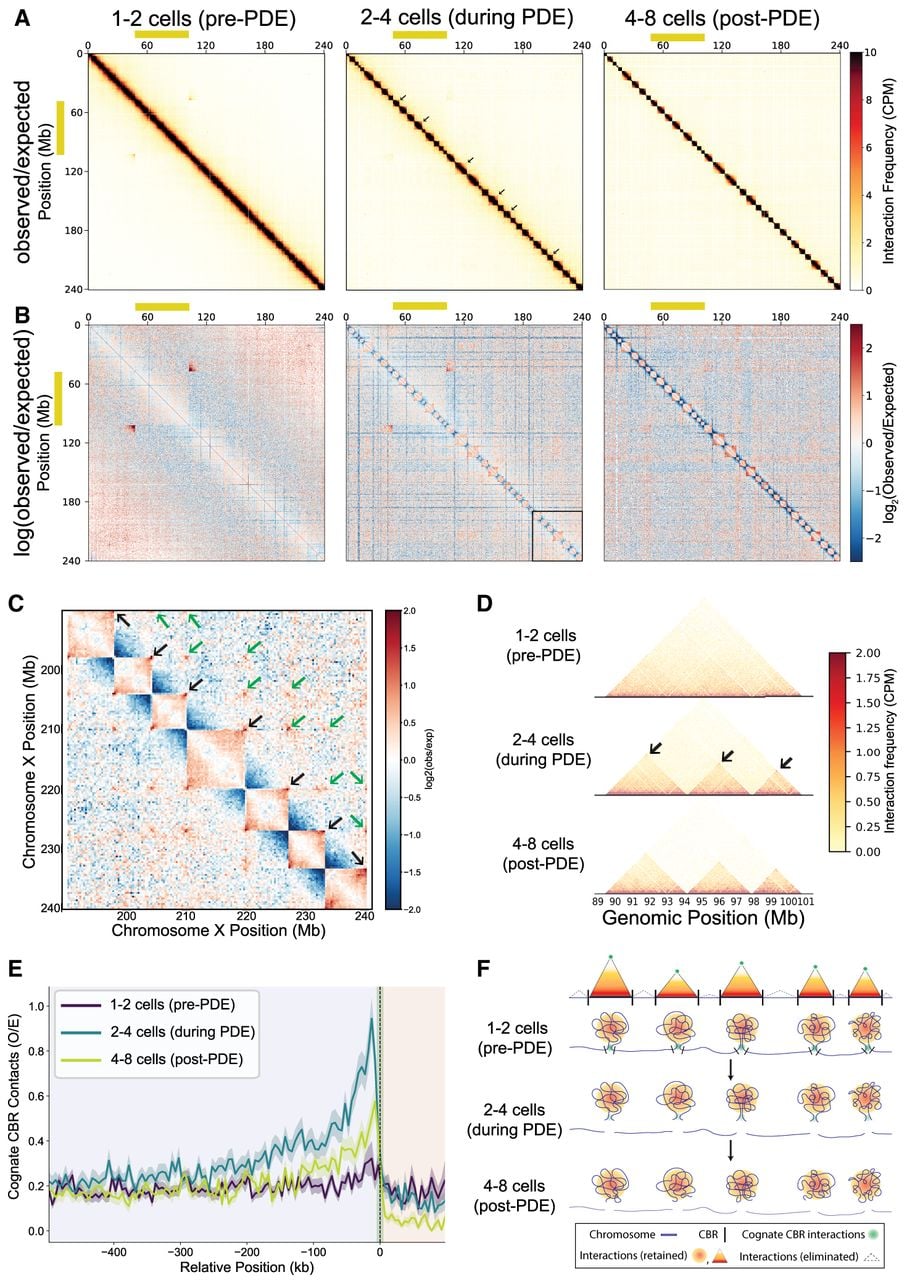
Transient cis interactions between cognate CBRs during Parascaris PDE. (A) Hi-C contact map of the Parascaris embryos before, during, and after PDE. The germline karyotype for female is XX and male is XY, in which the Y Chromosome lacks the sex chromosome region (yellow box). The apparent interaction between the two boundaries of the sex chromosome region arises because the sequences at the two boundaries are juxtaposed in the Y Chromosome of the males. Thus, in a population of embryos with mixed sexes, ∼25% of the chromosomes lack this region (Simmons et al. 2024). The map covers the ∼240 Mb assembled genome and the ∼2.2 Gb of repetitive heterochromatic arms that are eliminated (data not shown). The shown eliminated regions and all CBRs are internal and are ∼1 Gb away from the chromosome ends, so their interactions are unlikely affected by germline telomere interactions. (B) Pairwise CBR interactions during Parascaris PDE. Observed/expected contact ratio map for the same stages as in A. Strong focal interactions are visible between cognate CBR pairs. (C) Zoomed-in portion of the Hi-C heatmap delineated in B (two to four cells, during-PDE) showing interactions among CBRs from a selection of autosomes. Black arrows indicate interactions between cognate CBRs; green arrows indicate interactions between noncognate CBRs. (D) Exemplary dynamic CBR interactions throughout PDE. Interaction frequencies across Chr X 89–101 Mb are shown before, during, and after PDE. Black arrows mark the cognate CBR interactions. (E) Parascaris CBRs spatially demarcate the retained and eliminated DNA. The normalized contact frequency between cognate CBRs. Hi-C interactions for 500 kb of retained DNA (left) and 100 kb of eliminated DNA (right) flanking all 72 CBRs (vertical dashed line) were plotted. The interaction peaks immediately at the break during PDE and is absent before and after. Note the interaction frequency falls to zero post PDE (four to eight cells) owing to the loss of the eliminated DNA. (F) A model for CBR interactions during Parascaris PDE. Germline Hi-C interactions among future somatic chromosomes are shown with red–orange–yellow–white scale triangles, and interactions among eliminated regions are outlined with dashed lines (not to scale). Green spots represent interactions between cognate CBR pairs near the ends of each future somatic chromosome. Note the resemblance of the pre-PDE chromosome structure to the “beads-on-a-string” model (Niedermaier and Moritz 2000).