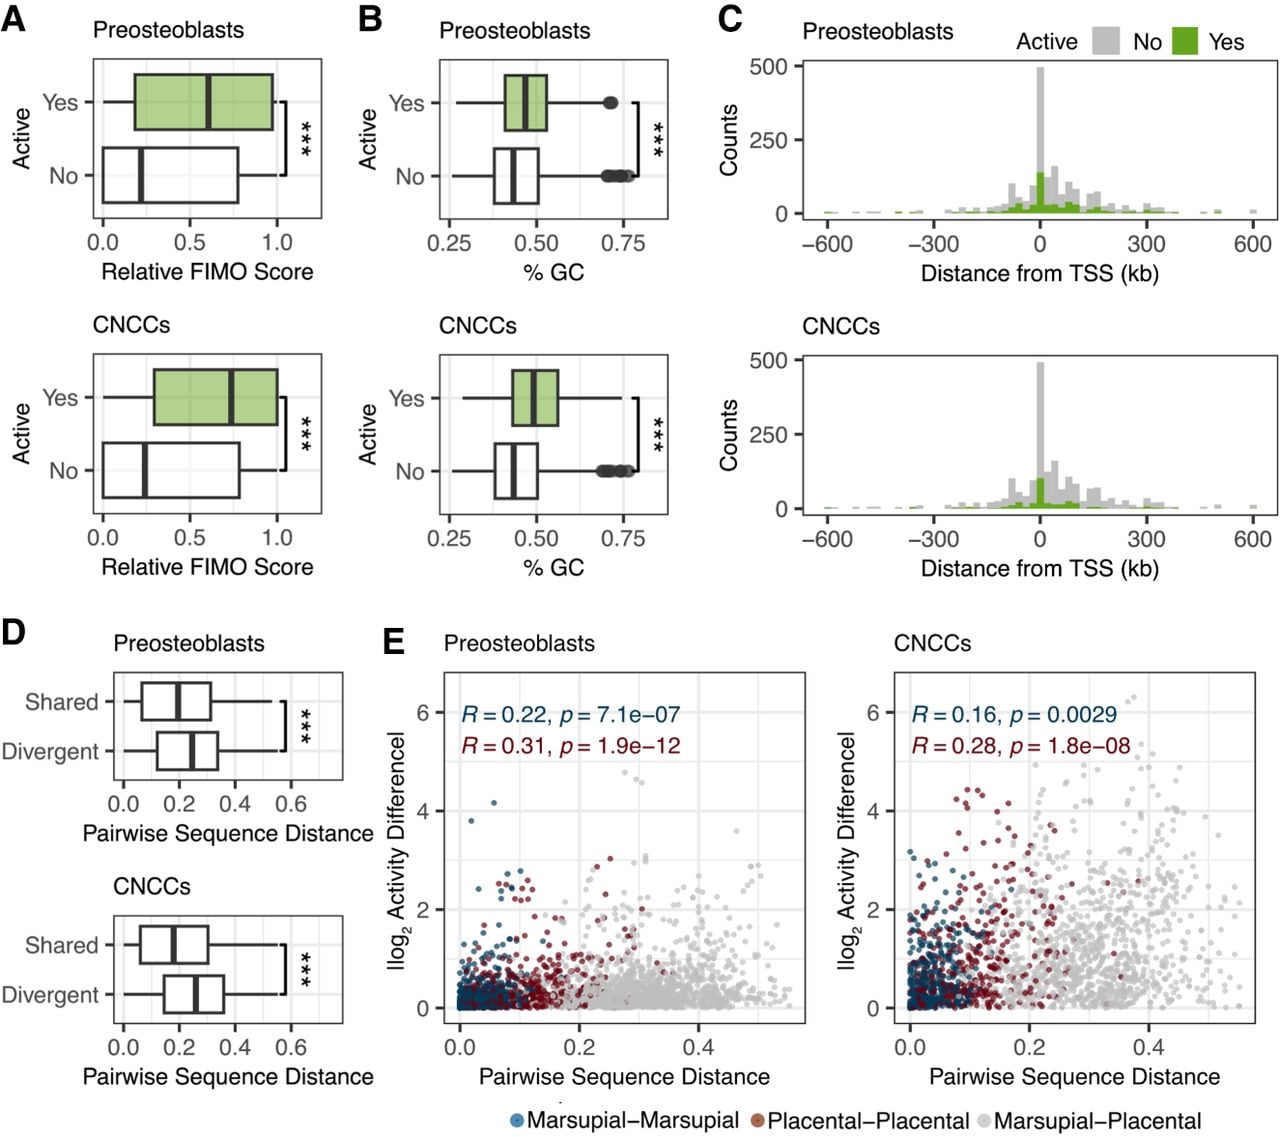
Figure 2.
Examining sequence features driving the activity of TWARs. Distribution of (A) aggregated FIMO scores and (B) percentage GC content for active and nonactive TWARs, for both cell lines. (C) Distribution of active and nonactive TWARs in cell lines by their distance from a transcription start site in the mouse genome. (D) Distribution of pairwise sequence distances between each pair of TWAR orthologs that display shared or divergent activity. (E) Correlation between pairwise sequence distance and absolute activity differences for each pair of TWAR orthologs.