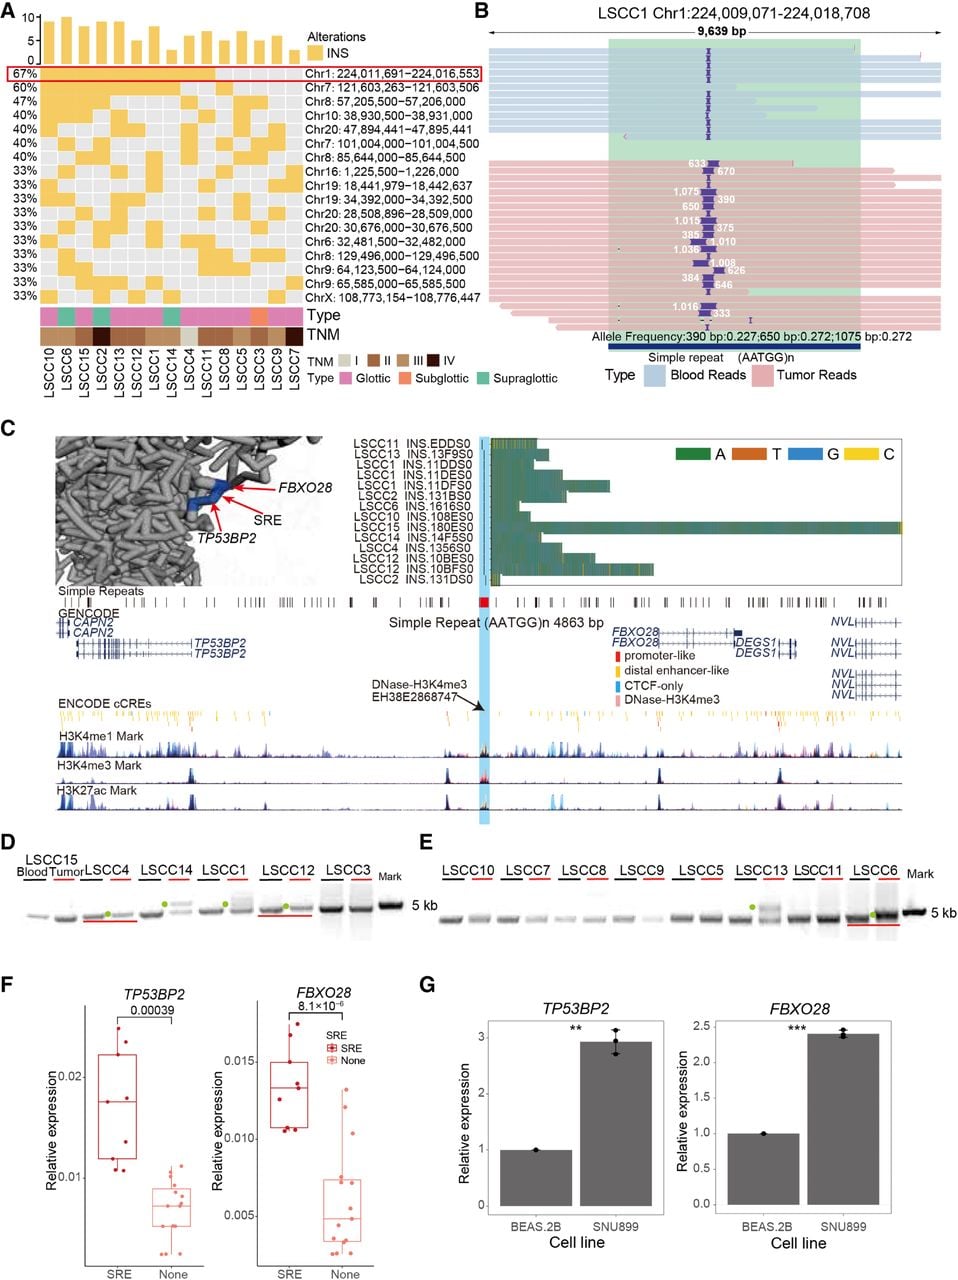
Overview of somatic SRE shared by 66% of samples. (A) Oncoplot of INS sample enrichment regions. Rows represent samples, and columns represent regions. (B) IGV plot of somatic SREs (LSCC 13, Chr 1: 224,009,042–224,018,679). Light blue represents reads from blood samples, pink represents reads from tumor samples, and dark blue indicates the simple repeat region with the AATGG motif. (C) Browser plot of somatic SREs (Chr 1: 224,009,042–224,018,679) illustrating the following epigenomic signals: a stacked bar chart of SRE positions and inserted sequences, with different colors representing different bases; the plot concludes with the AATGG motif of the repeat, the ENCODE-annotated gene transcript, and candidate cis-regulatory elements (cCREs) predicted by ENCODE. Also included are H3K4me1, H3K4me3, and H3K27ac marks predicted by ENCODE. In the upper left corner, the predicted 4D nucleosome structure around the LSCC-enriched SRE, TP53BP2, and FBXO28 is displayed. (D) Horizontal gel electrophoresis images showing DNA fragments from blood and tumor tissues of LSCC samples sequenced using nanopore technology. Each sample's blood and tumor are labeled separately, and green dots and red lines mark the longer bands in the tumor relative to the blood. (E) Horizontal gel electrophoresis images showing DNA fragments from blood and tumor tissues of LSCC samples sequenced using nanopore technology. Each sample's blood and tumor are labeled separately, and green dots and red lines mark the longer bands in the tumor relative to the blood. (F) Relative expression levels of TP53BP2 and FBXO28 determined by QCPCR in SRE and no SRE clinical samples (t-test). (G) Relative expression levels of TP53BP2 and FBXO28 determined by QCPCR in the BEAS 2B and SNU899 cell lines. t-test, (*) P-value < 0.05, (**) P-value < 0.01, (***) P-value < 0.001.