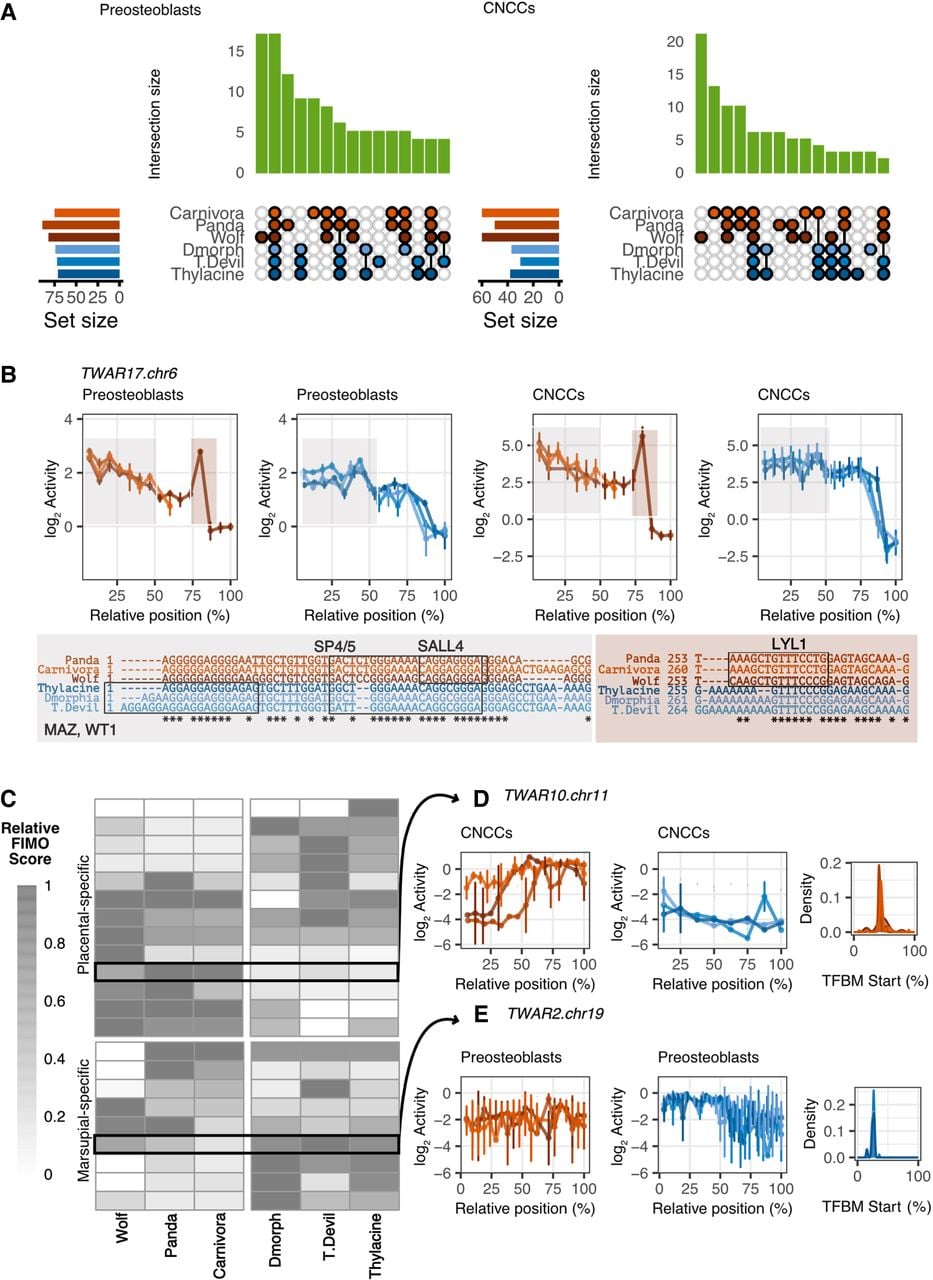
Functional conservation of activity across taxa. Dark blue: thylacine, medium blue: Tasmanian devil, light blue: Dasyuromorphia; dark red: wolf, medium red: panda, light red: Carnivora. (A) UpSet plot (top 15 combinations) displaying overlap in active TWARs among the six focal taxa across both cell lines. (B) Patterns of activity across tiles for TWAR17.chr6 in marsupial and placental taxa. Due to variation in the number of tiles across taxa, tile number has been summarized as relative to the total number of tiles (“Relative position”). Boxes identify TFBMs motifs present in the sequences for this TWAR highlighted in the plots. (C) Heatmap of relative FIMO scores for every TWAR with marsupial- or placental-specific activity in either cell line. (D) Activity across tiles of the placental-active TWAR10.chr11 for all taxa in the CNCCs, along with distribution of binding motifs across sequence length for the placentals. (E) Activity across tiles of the marsupial-active TWAR2.chr19 for all taxa in the preosteoblasts, along with distribution of binding motifs across sequence length specifically for the marsupials.