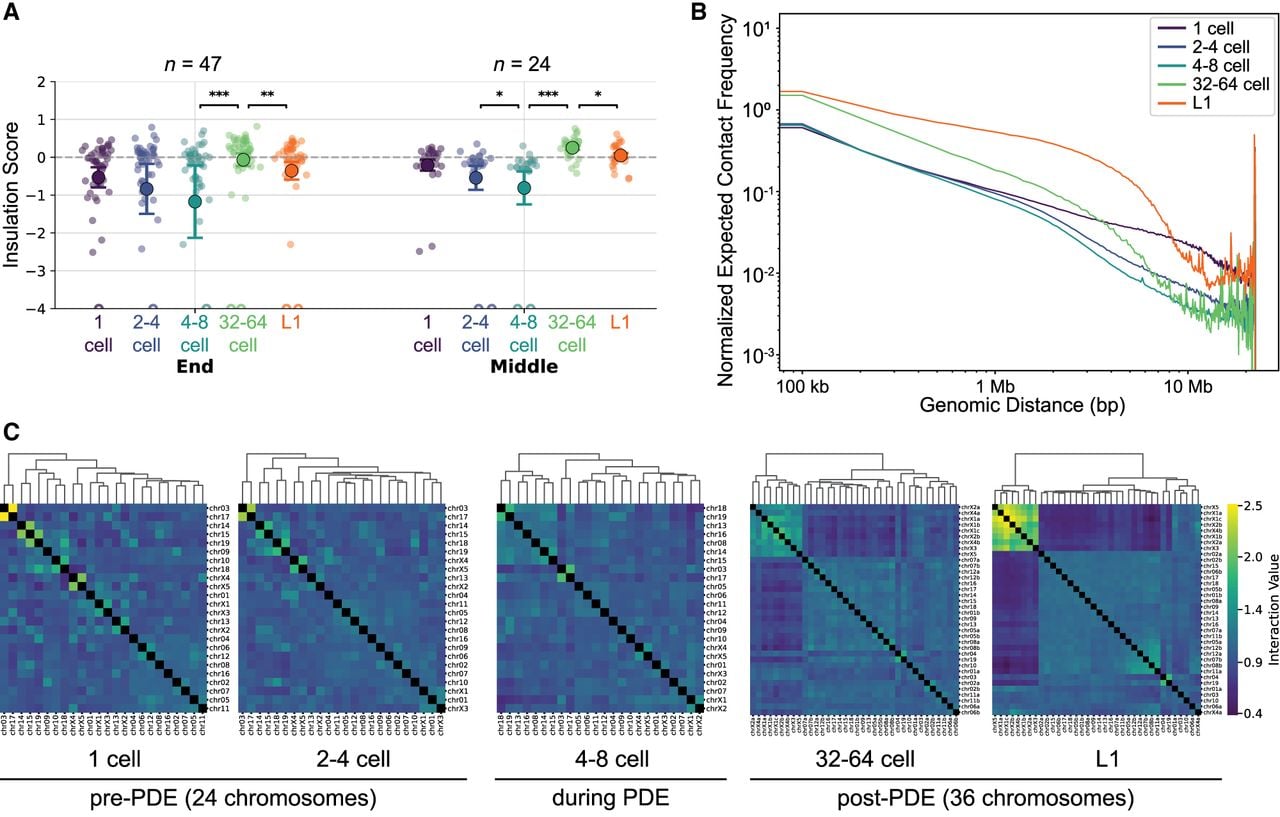
3D chromosomal changes during embryogenesis and in response to programmed DSBs. (A) Dynamic changes of insulation for retained ends of chromosomes. Insulation scores for 100 kb regions of retained DNA proximal to the end (47 sites; left) and middle (24 sites; right) of the chromosomes were determined. Shown are mean values with bars representing 1 SE. Each dot represents the end of a somatic chromosome (or future somatic chromosome in pre-PDE stages). Statistical significance was calculated using a two-sided Mann–Whitney U-test: (***) P < 0.001, (**) P < 0.01, and (*) P < 0.05. Data points lower than −4 are shown as empty circles at the lower boundary. (B) Changes in middle and long-range Hi-C interaction. Distance-decay curves for whole-genome Hi-C interaction data at different developmental stages. The normalized expected contact frequency (y-axis) is plotted against genomic distance (x-axis) on a log–log scale. (C) Changes in the 3D interaction among chromosomes. Chromosomal cluster analysis was performed at each developmental stage. Pre-PDE genomes are shown with 24 chromosomes, whereas post-PDE genomes are shown with 36 chromosomes. Strong clusters emerge after PDE as observed in the group of sex chromosomes (top left corners) in the 32-cell to 64-cell embryos and L1 larvae.