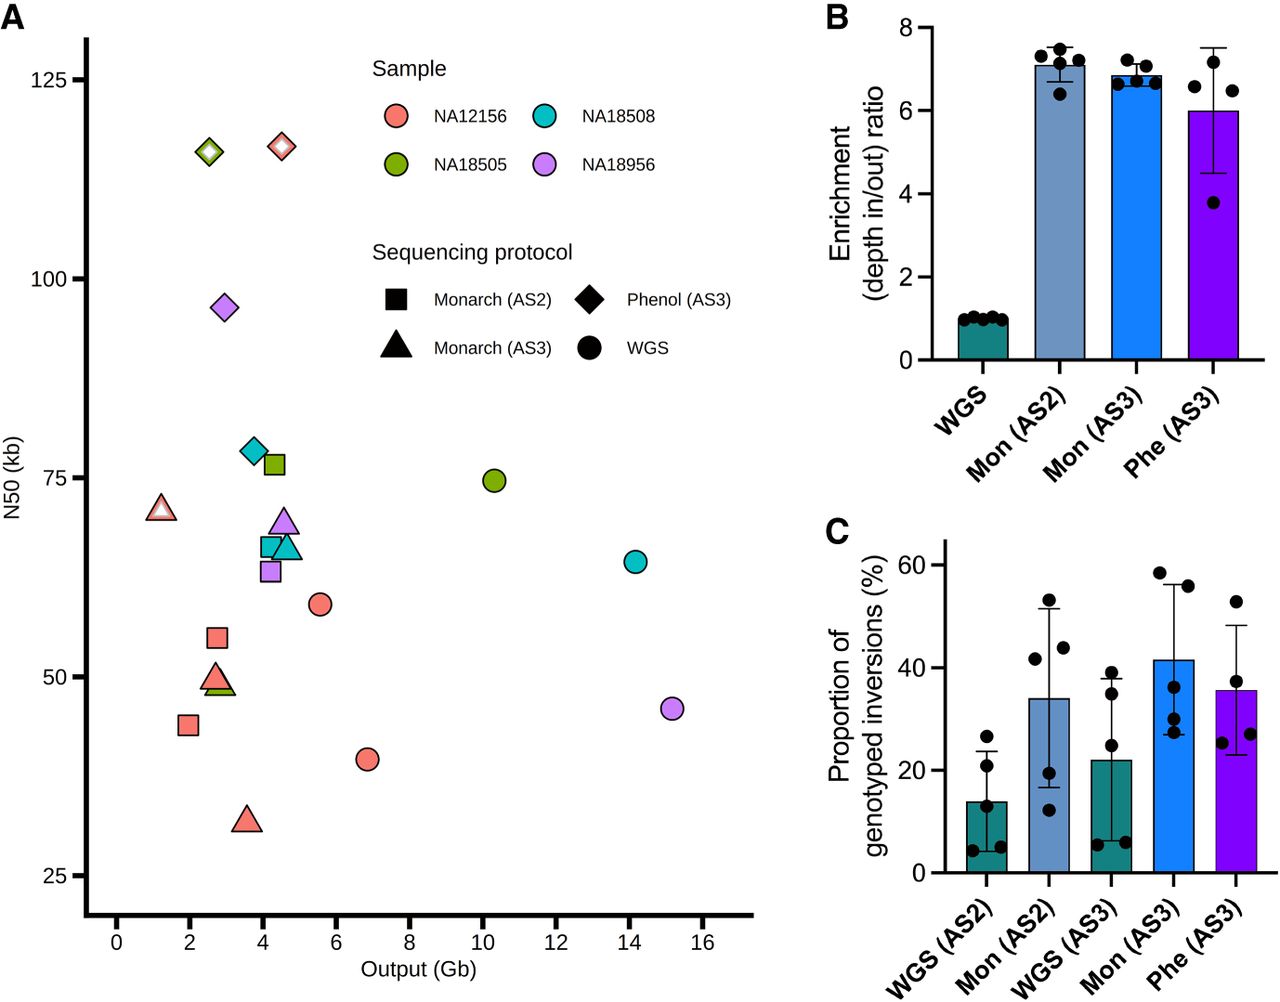
Summary of ONT sequencing experiment results. (A) Comparison of the N50 value and the total output of each sequencing run of the four analyzed samples (in different colors). Diverse sequencing protocols using whole-genome sequencing (WGS) or adaptive sampling (AS2/AS3) and DNA isolation methods (Monarch HMW or phenol) are represented by different shapes, whereas empty symbols indicate the use of fresh cells as starting material. (B) Enrichment ratio between the read depth inside and outside the targeted regions (depth in/out) of each sample for diverse types of sequencing (black dots), showing a six- to sevenfold average enrichment in AS2 or AS3 compared with WGS (colored bars). (C) Average proportion of genotypes obtained for the analyzed inversion regions normalized to the number of AS2 or AS3 targets (percentage, colored bars). Values for each sample (black dots) show considerable variation due mainly to sequencing output differences.