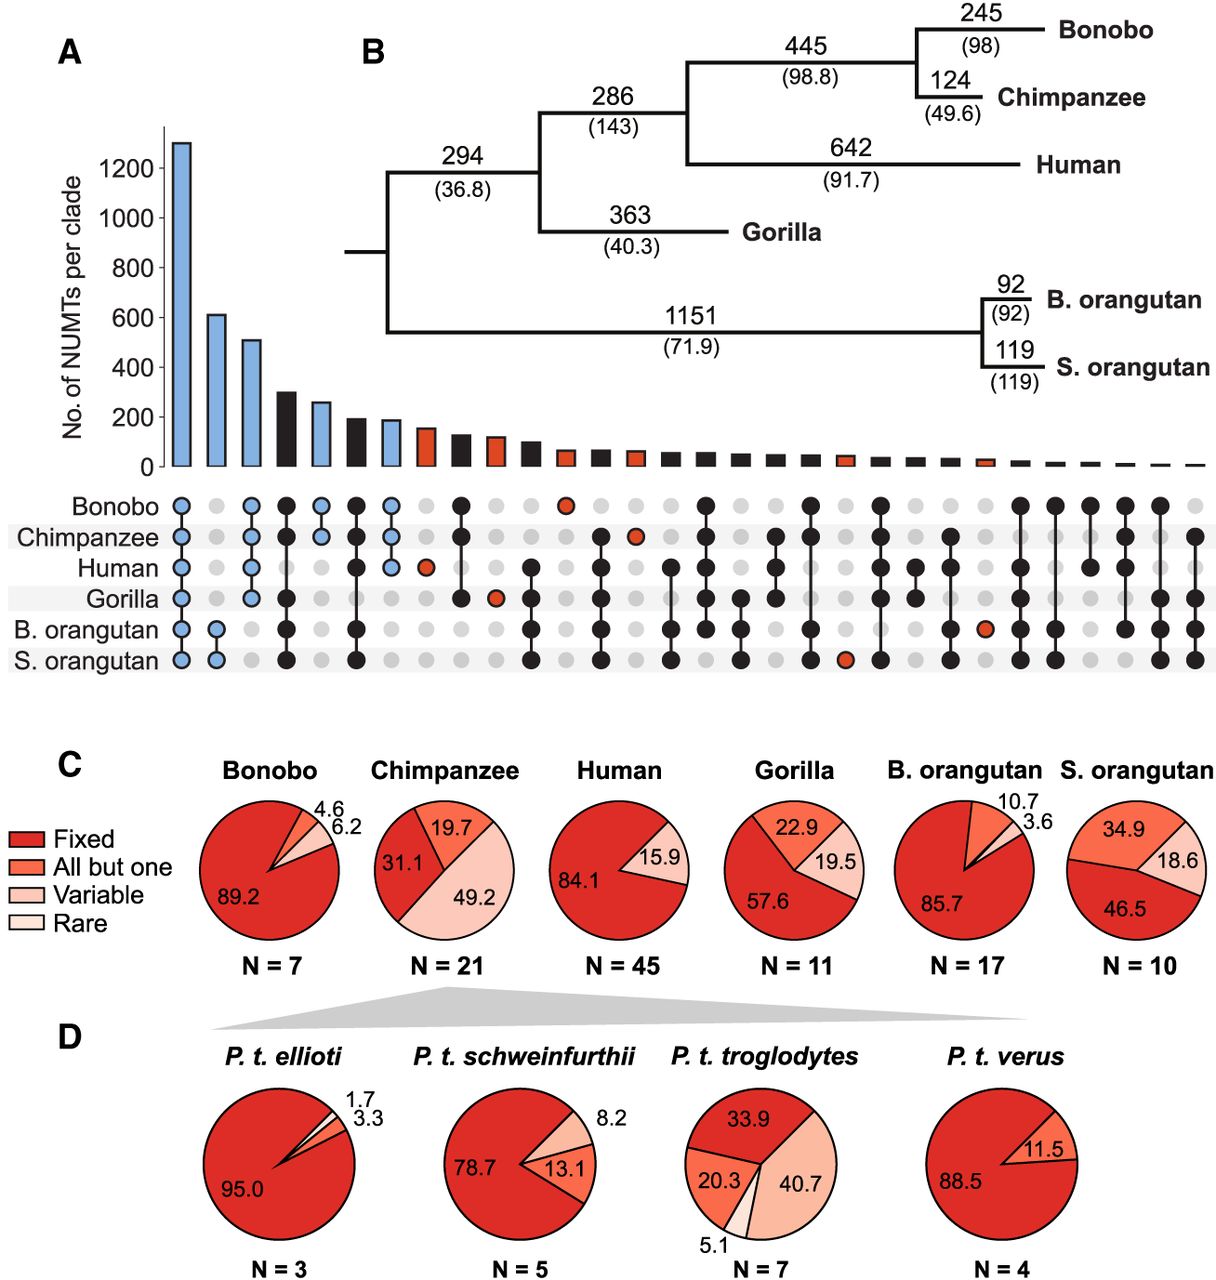
Shared and lineage-specific NUMTs in the primary haplotype, as well as species-specific NUMTs across populations. (A) Upset plot of shared and lineage-specific NUMT insertions (for details, see text and Methods). The 30 most abundant clades are plotted, with species-specific NUMTs in red and those forming natural clades in blue. For the complete set of clades, see Supplemental Figure S4. (B) Maximum parsimony tree of shared and lineage-specific NUMTs. Branches are annotated with the number of branch-specific NUMTs. The rate of NUMT accumulation, NUMTs per MY, is given in parentheses. For a detailed list of which NUMTs are shared, see Supplemental Data 2. (C) The proportions of species-specific NUMTs classified as fixed, shared by all but one individual, variable, or present in a single individual (rare) within populations of nonreference samples, are indicated as percentages. The number of individuals per species (N) is included below each chart. (D) Polymorphism analysis of chimpanzee-specific NUMTs conducted separately for each chimpanzee subspecies. Colors are as in C.