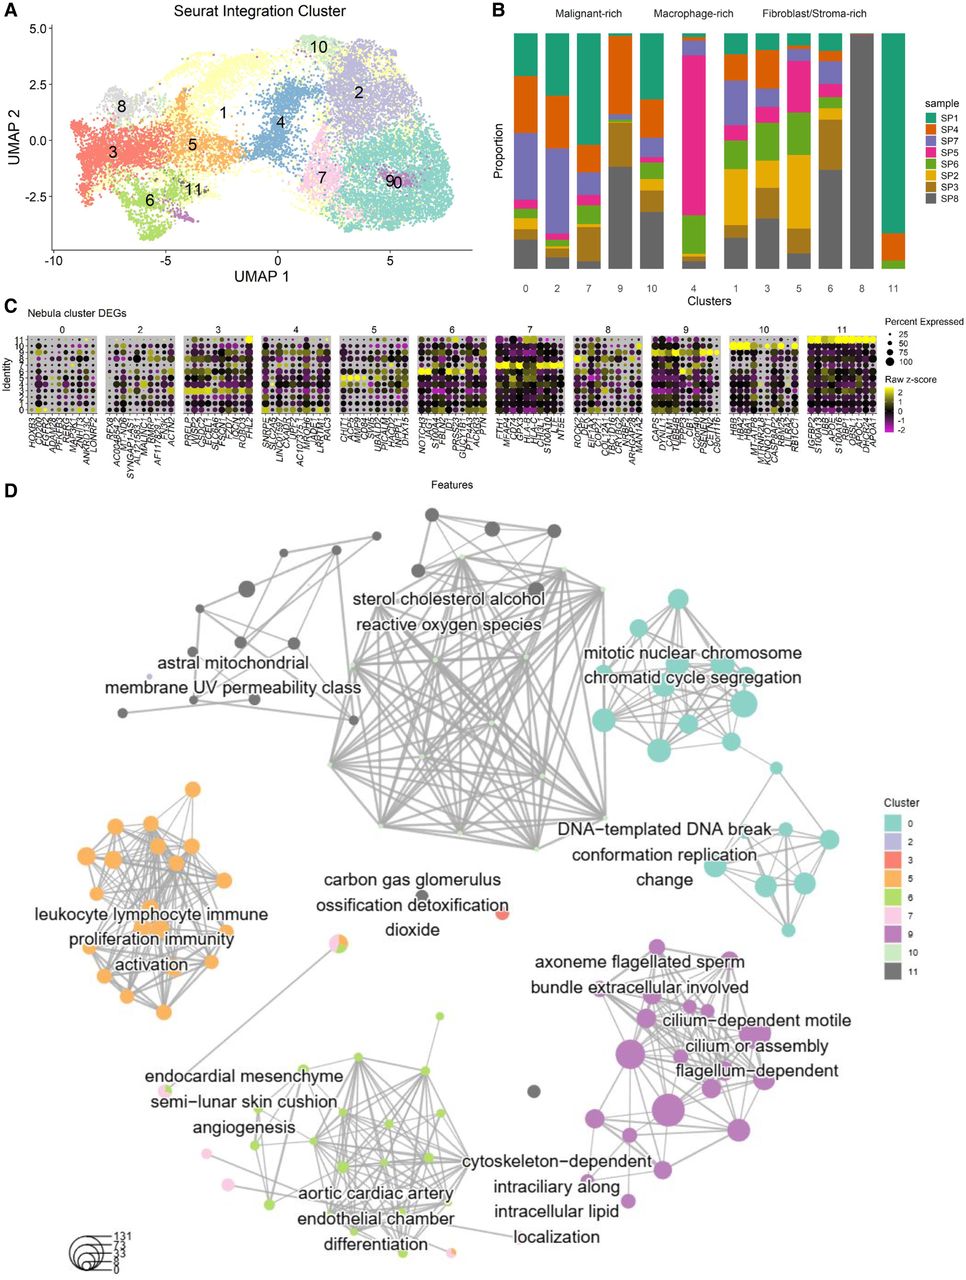
Figure 4.
Functional characterization of predicted spatial domains in HGSC tumors. (A) UMAP representation of the N = 8 Denisenko (Denisenko et al. 2024) integrated Visium samples colored by k = 12 predicted spatial domains. (B) Stacked bar plot representing the relative proportions of spots sourced from each sample stratified by each predicted spatial domain. (C) Dot plot of marker gene expression of cluster-specific DEGs. Spatial domain 1 had fewer than five significant DEGs and hence was omitted. (D) Gene concept network plot showing the Gene Ontology (GO) results using clusterProfiler (Wu et al. 2021b) based on spatial domain-specific, upregulated DEGs sets with the edges indicating the biological pathways.