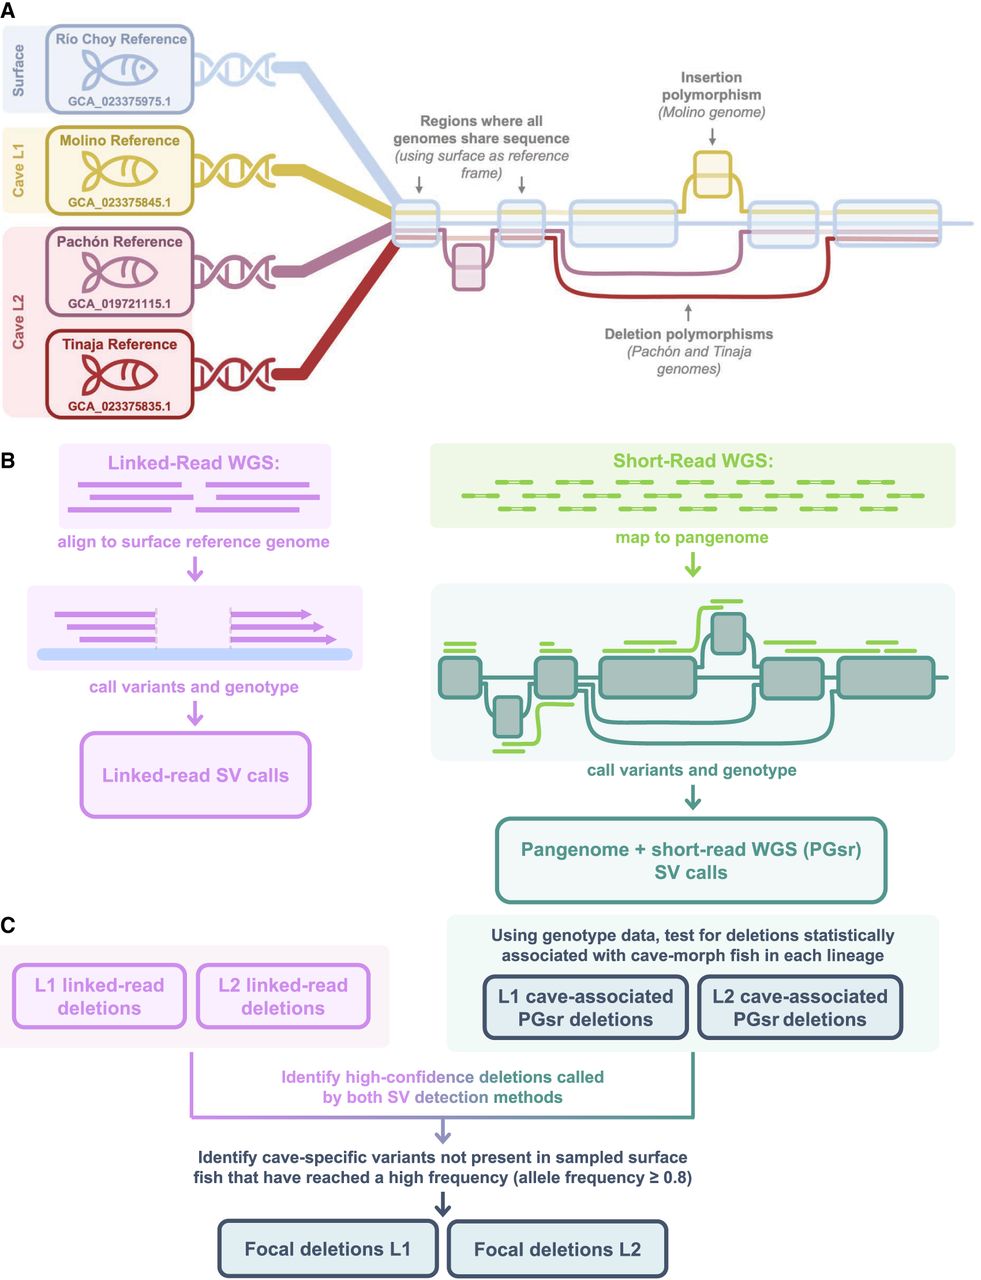
Figure 2.
Graphical overview of study design. (A) Graphical representation of pangenome graph construction using surface fish genome as a reference frame, as well as examples of insertion and deletions represented in the pangenome graph. (B) SV calling methods from linked-read sequencing (left) and mapping short-read sequencing to pangenome graph (right). (C) Integration of SV calls from different calling methods and filtering of SV deletion variants to generate a set of focal deletions used for downstream analyses.