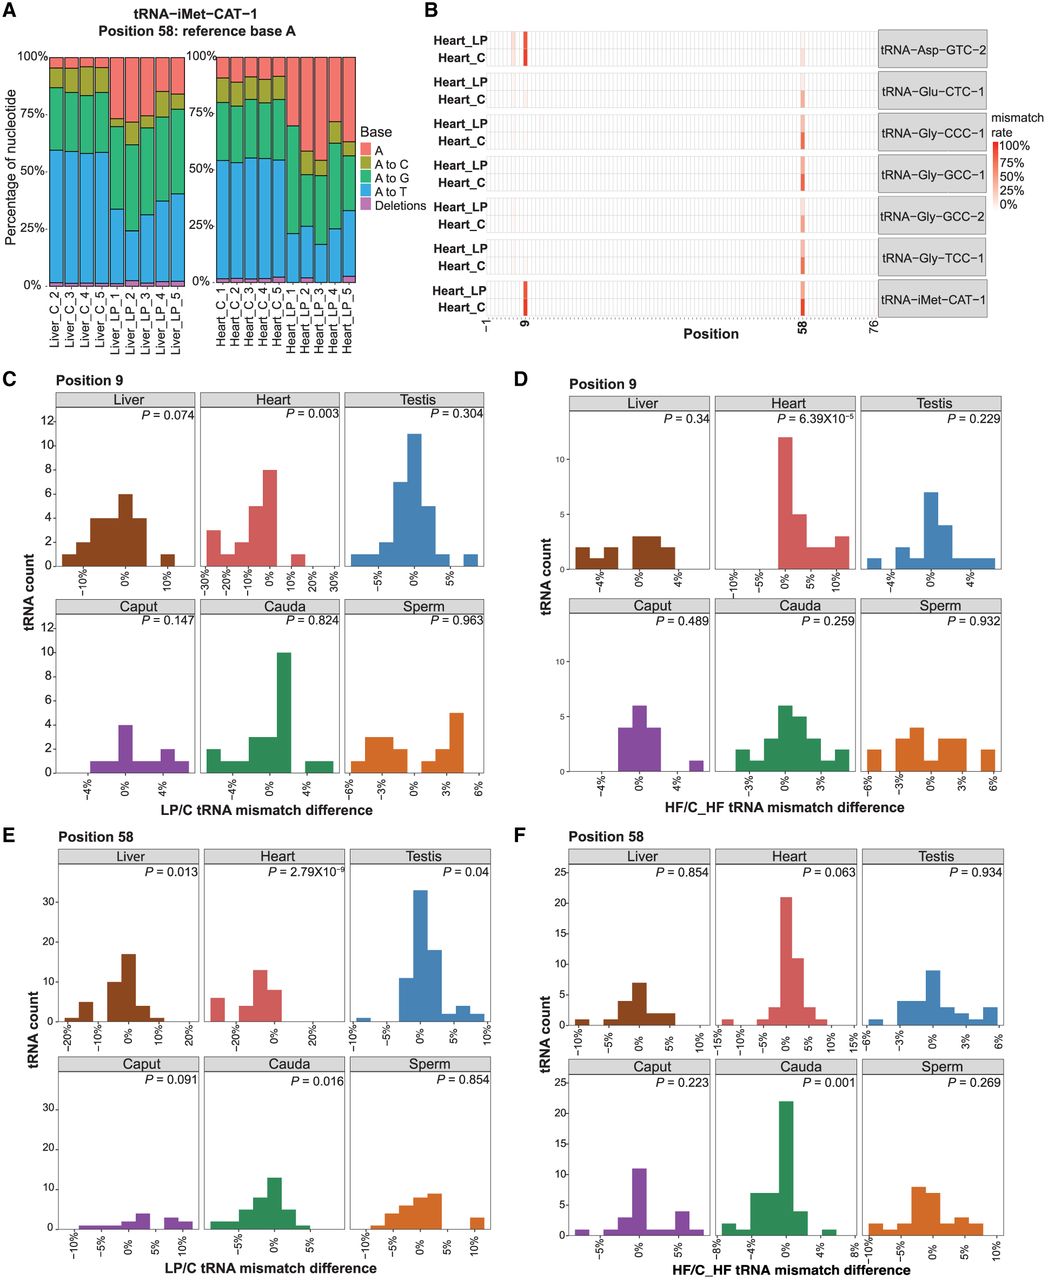
Dietary alterations impact tRNA modification levels. (A) Mismatch rates at position 58 of tRNA-iMet-CAT-1 in C and LP liver and heart samples, with nucleotide percentages represented by different colors and reference bases as A. Liver_C_1 was excluded from analyses owing to insufficient coverage (fewer than 20 reads at position 58). (B) Heatmap showing mismatch rates at all positions in specific tRNA isodecoders in heart tissues under LP and C diet conditions. (C,D) Histograms show the number of tRNAs and the difference in median mismatch rates at position 9 in LP tissues relative to C (C) and HF tissues relative to C_HF (D). (E,F) Histograms show the number of tRNAs and their median mismatch rates at position 58 in LP tissues relative to C (E) and HF tissues relative to C_HF (F). A Wilcoxon signed-rank test comparing median mismatch rates across tRNAs between dietary conditions and matched controls was performed to identify significant changes (P < 0.05).