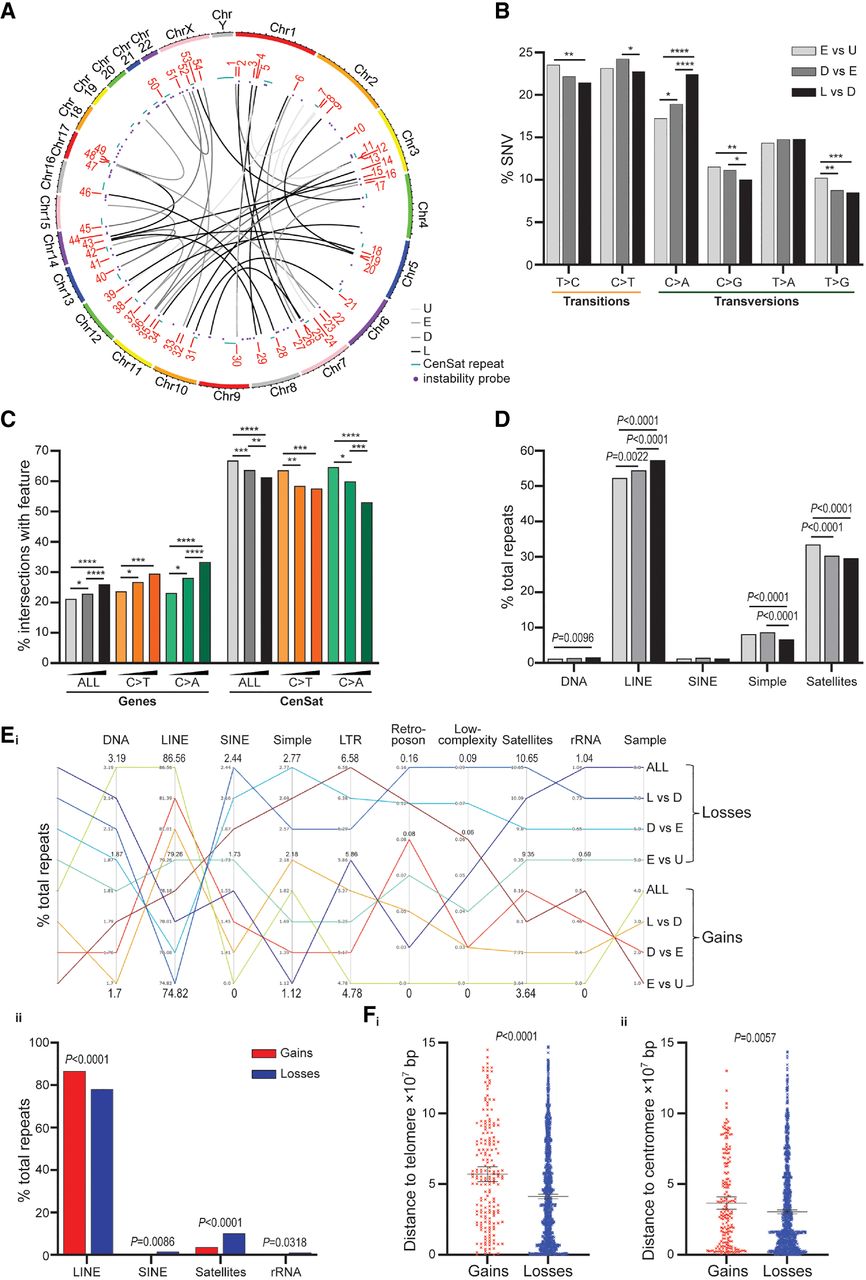
Mutational shifts with crisis progression. (A) The genomic distributions of 38 structural variants (SVs) called by Manta (Chen et al. 2016) from targeted capture sequence data for Untransformed (U; pale gray) and MRC5E6E7 undergoing replicative crisis depicted as Circos plot (Yu et al. 2018) links. (E) Early crisis, (D) Deep crisis, and (L) Late crisis. Colors are from mid-gray to black. Genes incorporated into the SVs are numbered and decoded in Supplemental Table S3. The chromosome identities, centromere positions (denoted by CenSat repeats), and locations of the genome instability probes featured on the targeted capture panel are indicated. (B) The percentages of all single-nucleotide variants (SNV) called using VarDict (Lai et al. 2016) for pairwise pseudo-tumor-normal (Early crisis vs. Untransformed, Deep vs. Early crisis, and Late vs. Deep crisis) comparisons of MRC5 samples sequenced following targeted capture are displayed. Transitions (purine–purine or pyrimidine–pyrimidine) are underscored in orange (left); transversions (purine ↔ pyrimidine), in green (right). Comparisons of SNV proportions in progressive samples were performed with the N − 1 χ2 method, and results are displayed as (*) P < 0.05, (**) P < 0.01, (***) P < 0.001, and (****) P < 0.0001. (C) The proportions of all SNV or specifically C > T transitions or C > A transversions identified in pairwise pseudo-tumor-normal MRC5 comparisons that coincide with coding sequence (Genes) or centromeric satellites (CenSat) are displayed in a bar chart and compared using the N − 1 χ2 method. (D) Overlaps between all SNVs called from progressive pseudo-tumor-normal MRC5 sample pairings and specific repeat elements (x-axis) are displayed as proportions of the total overlaps with repeats and evaluated in the same way (P-values recorded); (SINE) Short interspersed repeat, (LINE) long interspersed repeat. (E, i) A parallel plot displaying the proportions of specific DNA repeat elements (listed along the top) comprising the total repeats intersections with the altered copy number (CN) data sets indicated on the right (lower gains and upper losses for each pairwise sample comparison). (All) The genomic intervals common to all pairwise CN gains or CN losses. The upper and lower boundaries of the proportions are annotated at the top and bottom of the chart, respectively. (LTR) Long terminal repeat, (rRNA) ribosomal RNA repeats. (ii) A bar chart displaying the most salient differentials (evaluated using the N − 1 χ2 method) between the genomic intervals common to CN gains or CN losses with respect to DNA repeat associations. (F) The distance to the telomere on the same chromosome arm (i) or centromere (ii) of CN gains and losses common to all pairwise sample comparisons; statistical assessments by Mann–Whitney unpaired nonparametric U tests.