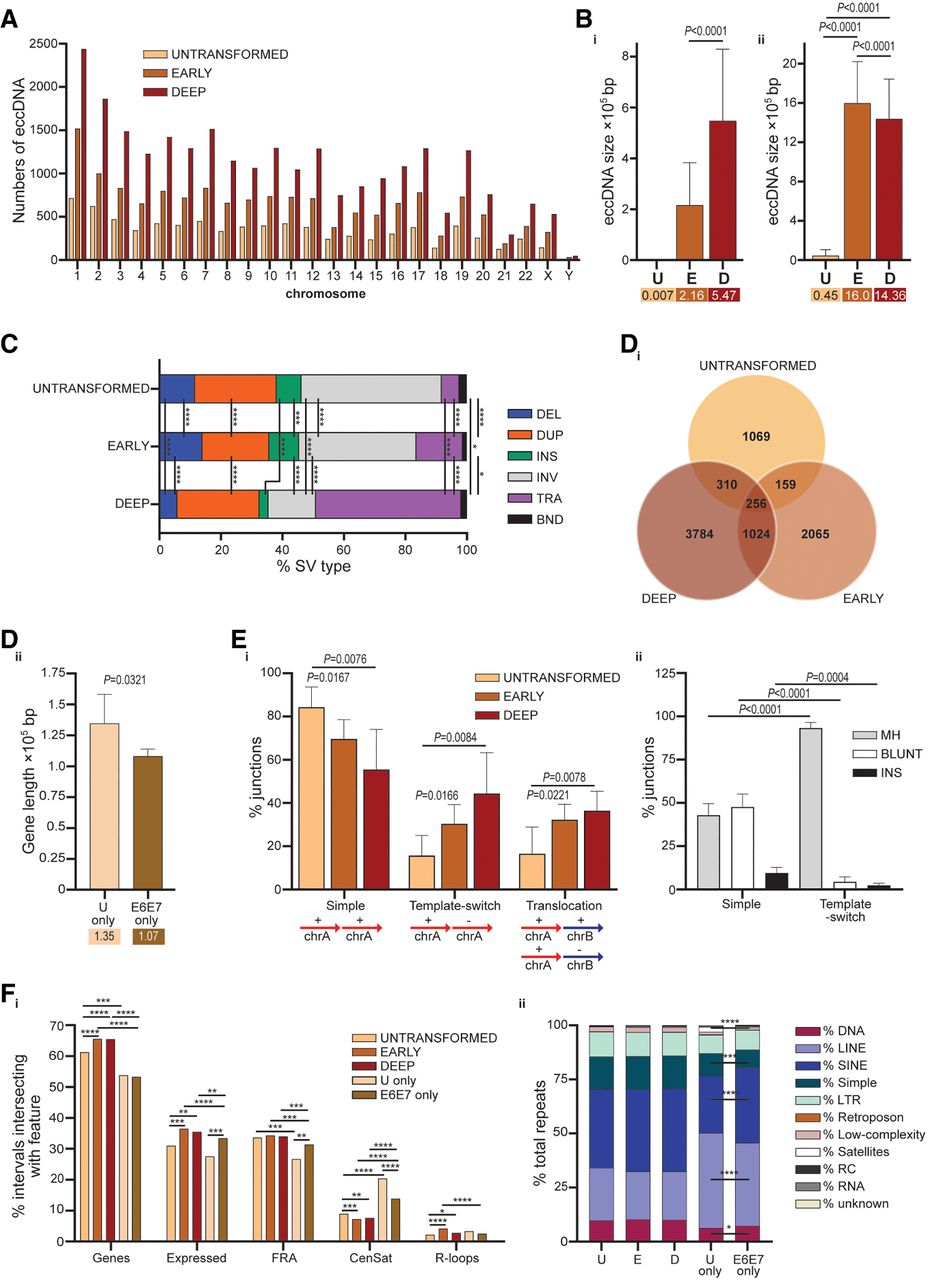
Distinct quantities and characteristics of extrachromosomal circular DNA are detected in untransformed and crisis MRC5 cells. (A) The quantities of all sequenced eccDNA junctions amplified from Untransformed MRC5 (U; six replicas) and Early (nine replicas) and Deep (six replicas) crisis MRC5E6E7 cells are displayed by chromosome. (B) Bar chart displaying mean sizes in base pairs with 95% CI for Illumina short-read sequenced (i) or Pacific Biosciences (PacBio) long-read sequenced (ii) simple eccDNA. Mean values × 105 bp are displayed in colored boxes below the bars. Statistical evaluation was by Mann–Whitney unpaired nonparametric U tests. (C) Stacked chart displaying the relative proportions of distinct structural variants (SVs) called from the PacBio long-read eccDNA sequencing data for Untransformed MRC5 and Early- and Deep-crisis MRC5E6E7 cells. (DEL) Deletions, (DUP) duplications, (INS) insertions, (INV) inversions, (TRA) translocations, and (BND) break-end rearrangements that cannot unambiguously be categorized as a single canonical SV. Vertical black lines connect data sets evaluated using the N − 1 χ2 method, with results displayed as (*) P < 0.05, (**) P < 0.01, (***) P < 0.001, (****) P < 0.0001. (D, i) Venn diagram showing the numbers of direct gene overlaps among the eccDNA derived from Untransformed MRC5 and Early- or Deep-crisis MRC5E6E7 cells. (ii) The lengths of genes (means annotated below the x-axis) uniquely identified within genomic intervals assigned to eccDNA from Untransformed (U only) or transformed (E6E7 only) MRC5 cells are displayed in a bar chart with means and 95% CI. Mean values × 105 bp are displayed in colored boxes below the bars. Differences were assessed by unpaired parametric t-tests with Welch's correction for unequal standard deviations (SD). (E, i) The proportions of eccDNA junctions amplified from Untransformed and Early- and Deep-crisis MRC5 samples that comprise DNA segments derived from the same strand (“Simple”) or opposing strands (“Template-switch”) or distant chromosome locations (“Translocation”) are depicted as a bar chart of means with 95% CI and compared using parametric unpaired t-tests with Welch's correction. A schematic depicting DNA orientation at the eccDNA junctions (ChrA, ChrB) is shown below the chart. (ii) Simple and template-switch junctions sequenced from all samples were examined for microhomology usage >1 bp (MH; pale gray) and inserted DNA sequences >1 bp (INS; black) or blunt joins (BLUNT; white). The proportions of junctions displaying each feature are presented in a bar chart and evaluated using unpaired nonparametric Mann–Whitney U tests. (F, i) Genomic intervals for eccDNA derived from Untransformed MRC5, Early- and Deep-crisis MRC5E6E7, or subsamples comprising Untransformed-only (U only) or transformed-only (E6E7 only) were intersected with the features indicated on the x-axis. (Genes) All coding sequence, (Expressed) genes expressed in crisis MRC5E6E7, (FRA) fragile sites, (CenSat) peri/centromeric repeats, and (R-loops) trinucleotide DNA structures. Pairwise comparisons were performed using the N − 1 χ2 method and results are displayed as (*) P < 0.05, (**) P < 0.01, (***) P < 0.001, (****) P < 0.0001. (ii) The same eccDNA sample (indicated on the x-axis) genomic intervals were intersected with DNA repeats (defined by RepeatMasker) (Smit et al. 2013), and the proportions of each repeat class (right-hand color key) are displayed in a stacked bar chart. The notable differences between the discrete Untransformed-only (U only) and transformed-only (E6E7 only) were evaluated with the N − 1 χ2 method, as in i. (RC) Rolling circle repeats, (RNA) grouped representation of all classes of RNA repeats: rRNA, tRNA, snRNA, scRNA, and srpRNA.