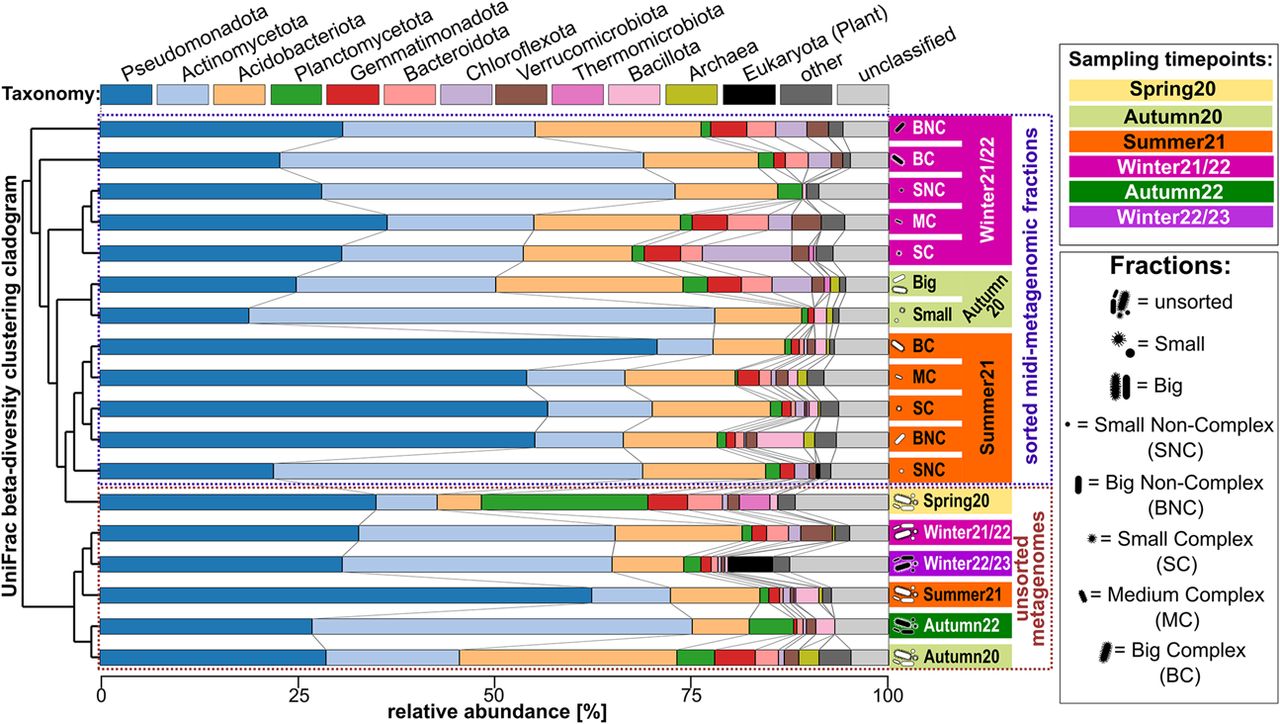
Figure 3.
16S rRNA gene-based diversity among different (midi-)metagenomic fractions of different samples. Clustering is based on weighted UniFrac (Lozupone et al. 2011) beta-diversity scores and is shown as a cladogram on the left. The background coloring of y-axis labels on the right side indicates the respective origin-sample. Stacked bar charts indicate the community composition of each sample and fraction, with different phyla being indicated by a distinct color code as indicated above the plot, and relative abundances being indicated by bar heights according to the x-axis below the plot. Sorted midi-metagenomic fractions are indicated by pictograms, and abbreviations are given in the legend on the right.