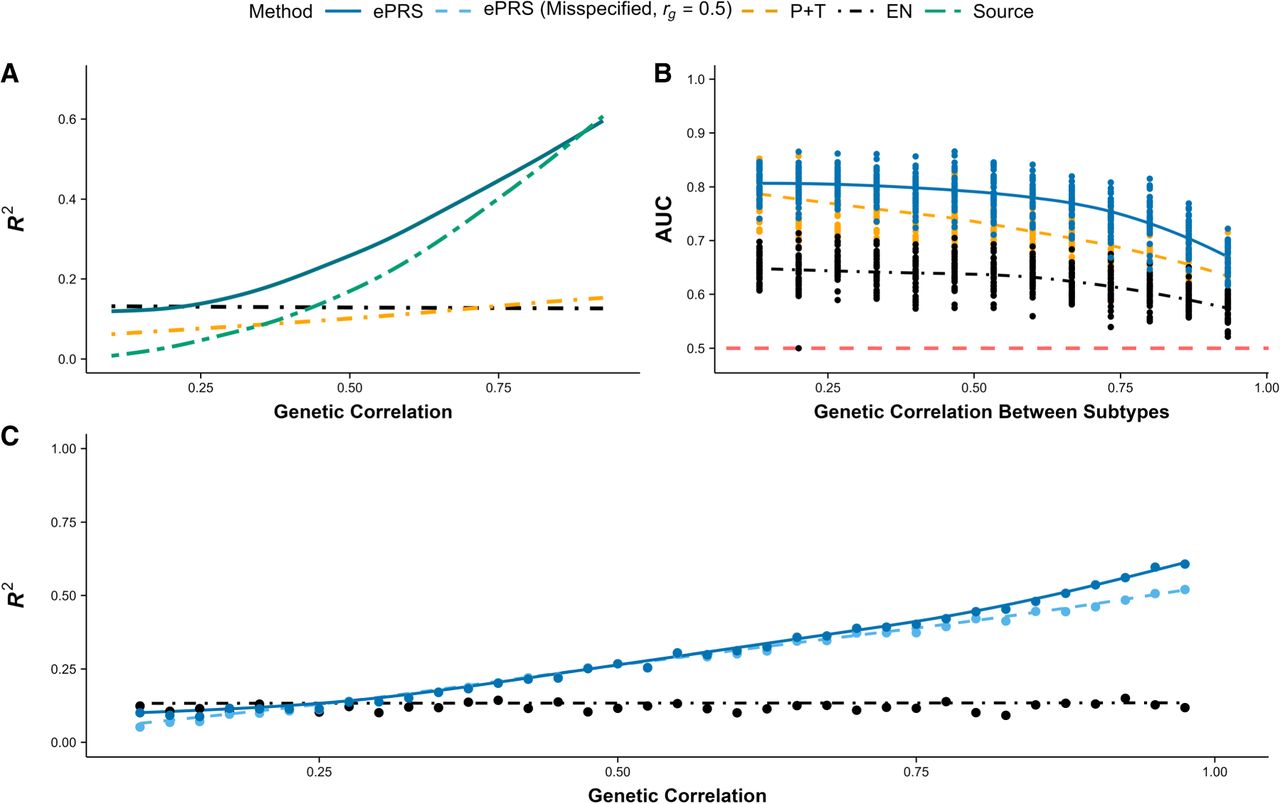
Simulation benchmarks of ePRS. Colors and line styles denote model type throughout the figure: blue, ePRS; orange, pruning and thresholding (P+T); black, elastic net (EN); and green, PRS derived from source GWAS summary statistics. Lines show smoothed mean performance across values of rg, and points indicate the values of rg at which performance was evaluated. In panel B, the red dashed horizontal line indicates random classification performance (AUC = 0.5). In panel C, the darker blue line indicates ePRS fitted using the true genetic correlation, and light blue indicates ePRS fitted using a fixed, misspecified genetic correlation. (A) ePRS demonstrates superior predictive performance against P+T, EN using the target phenotype cohort, and external GWAS summary statistics defined on the source phenotype (source). The simulated heritability of the target phenotype is h2 ≈ 0.7. (B) ePRS demonstrates stronger predictive capacity in differentiating between disease subtypes compared to conventional approaches including P+T and EN regression. Using GWAS summary statistics from the general phenotype would fail to distinguish between different subtypes, resulting in an AUC of 0.5, which is equivalent to random guessing (red dashed line). (C) Robustness of ePRS to misspecification of the genetic correlation rg. The x-axis shows the true genetic correlation used to generate simulated data, whereas ePRS is fit using either a fixed rg = 0.5 (light blue dashed curve) or the true rg (blue). EN is used as a reference because EN does not utilize rg. Misspecification leads to only modest attenuation in ePRS performance (blue/light blue remain close over the x-axis), and ePRS remains above EN except when the source and target phenotypes are uncorrelated. The simulated heritability of the target phenotype is h2 ≈ 0.7. (AUC) Area under the curve, (GWAS) genome-wide association study, (h2) heritability, and (rg) genetic correlation.